Where we left Off Last Time…
In the third part of this series, I left you with an introduction to the ANSYS Selection Manager and Geometry B-Rep. We also created a sample script that iterated over all of the faces in a selected body and created a named selection for each face. We built on our technique described in Part 2 for discovering ANSYS functionality.
Introducing the Microsoft Visual Studio Script Debugger
In this post I want to introduce you to the Visual Studio Script Debugger. Running ANSYS Mechanical underneath the debugger is definitely the most powerful tool we have at our disposal when it comes to creating custom scripts. If you can learn to use this tool effectively, you will be able to watch the inner workings of Mechanical interact with your scripts in a precisely controlled environment. Furthermore, the rich debugger displays will allow you to see most all of the mechanical objects in suspended animation and will also allow you to investigate their properties and methods in real time. Finally, the “Immediate Window” in the debugger will allow you to execute random pieces of code that you type in on the fly while Mechanical is suspended in the debugger. This will allow you to test out various techniques and code sequences in one debugging session. Simply put, you must become proficient at using the debugger to have any real hope of successfully scripting the ANSYS Mechanical tool.
Some Preliminaries
There are a number of steps you need to take to actually get the debugger environment set up properly. Here are a list of steps you need to take:
- You obviously need to install Visual Studio. I use Visual Studio Professional 2010, but I think any version including 2005 and above will probably be sufficient. I cannot speak to whether or not the Express Editions will work for this task, so if someone has experience with one of these editions and can shed some light, please post a comment.
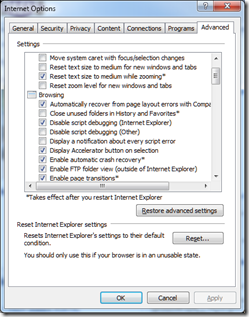
- In the Internet Explorer “Internet Options” dialog (arrived at through Tools->Internet Options…) you need to make sure that “Disable Script Debugging (Other)” is unchecked. See image below.
- Finally, you need to adjust the registry setting HKEY_CURRENT_USER\Software\Microsoft\Windows Script\Settings\JITDebug = 1
Debugging Code
The easiest way to stop Mechanical in the debugger is to insert the javascript “debugger” command wherever you would like to stop execution and look around. So, for example, lets assume we have the following script:
function my_func() {
    debugger;
    var my_array = new Array();
    for(var i = 0; i < 10; i++) {
        my_array[i] = 2*i;
    }
}

my_func();
As you can see above, this simple script consists of one function called my_func that just populates an array. The first statement in this function is the keyword debugger. If all works according to plan, when we execute this script, we’ll end up in the Microsoft Debugger. To make this all happen, you need to follow a ten step program:
- Start MS Visual Studio
- Start ANSYS Mechanical
- Copy the above script to a file named debug_test.js anywhere on your harddrive.
- Inside MS Visual Studio, navigate to Debug->Attach to Process…
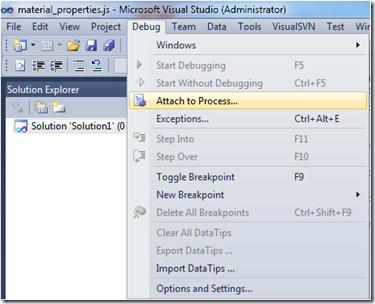
- In the dialog that pops up, look for the AnsysWBU.exe executable in the list.
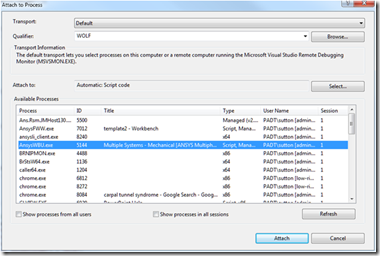
- Select AnsysWBU.exe and press the Attach button.
- Switch to the Mechanical Application
- From the tools Menu, choose Tools->Run Macro…
- Navigate to the location of debug_test.js and click open.
- Start debugging…
At this point you can set breakpoints, step into and out of functions, interrogate variable values, etc… The debugger is truly a remarkable tool, as we shall briefly touch on next.
Whirlwind Tour of the MS Debugger
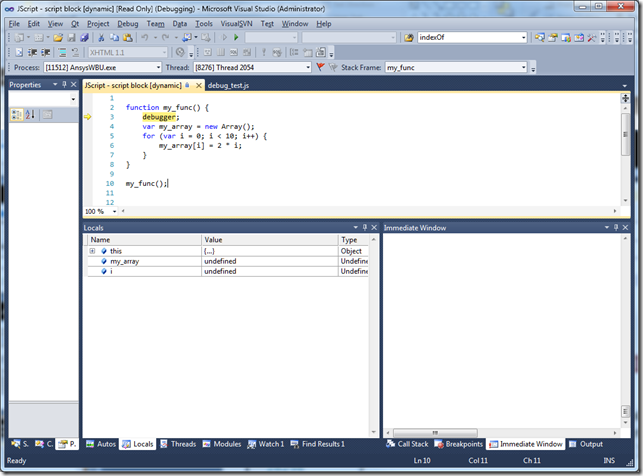
Below is a screen shot of our little script inside the visual studio debugger.
As you can see, the current execution line is located over the debugger statement. Pressing F10 will advance one line at a time. Also, you will notice that there is a window below the code window with a tab called “Locals” This tab shows the local variables defined in this function. At this point in the execution, they are not defined. However, as we step the execution, these variables will come into play. You can watch what happens to variables as you step through your code here.
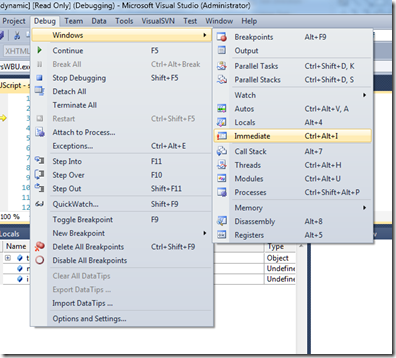
Also, you will notice a second window called the “Immediate Window”. This window may not be visible for your default debugging layout. If you don’t see it, navigate to Debug->Windows->Immediate Window
In the immediate window you can enter in code that will be executed “immediately” while the program is stopped in the debugger. So, for example, if you see a problem in your script that might be fixed with a code change you may be tempted to leave the debugger fix it and then re-run. However, if you are unsure of your fix, or if you want to try a number of alternatives, you can just type them into the immediate window and see what happens. It works as if you were executing new code at the current breakpoint location that isn’t in your script. You can then step forward in your script to execute a few lines, enter something in the immediate window, and then continue on stepping. It is a very powerful technique.
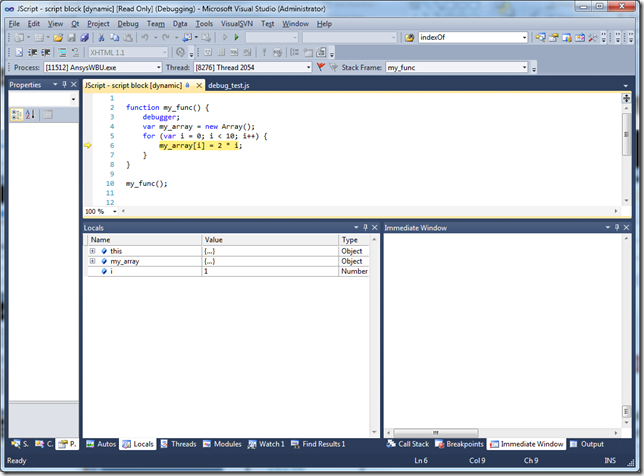
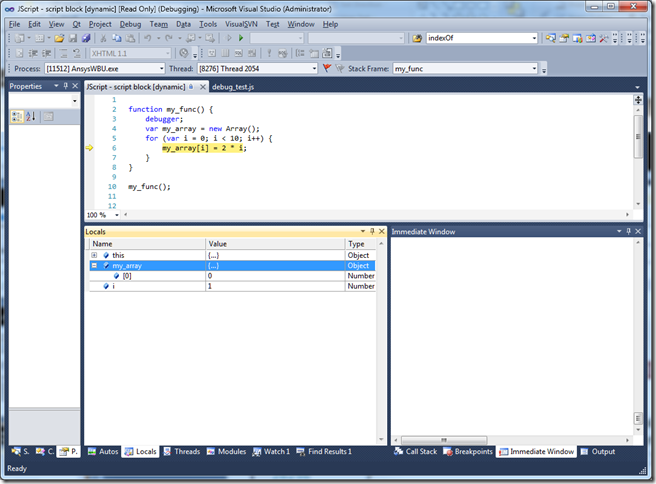
Lets step through a few lines. I’m going to press F10 four or five times. At that point I get the following screen.
You can see that my_array now has an ellipse next to it and I is equal to 1. If I click on the plus symbol next to my_array in the locals pane, I get the following:
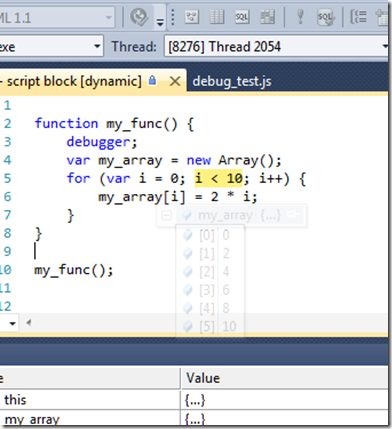
You can see that we’ve filled the zero-th item in the array with the value zero. Lets hit F10 some more… Note, you can also hover your mouse over the array in the code window. You can see I’ve filled in a few more values
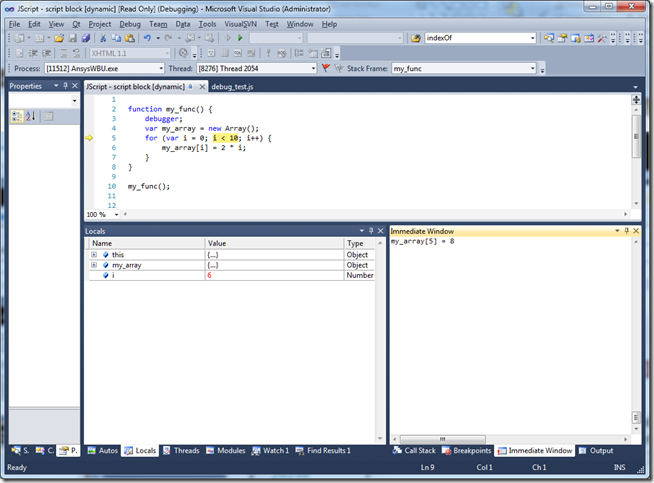
The print screen function doesn’t capture it well, but you can see the values in the array have changed. Now, lets say I just realized that for some code below to work properly, the fifth value in this array needs to be less than 10. (We don’t have any code below, and this is quite contrived, but bear with me and use your imagination…) So, I just pop down into the immediate window and type:
my_array[5] = 8;
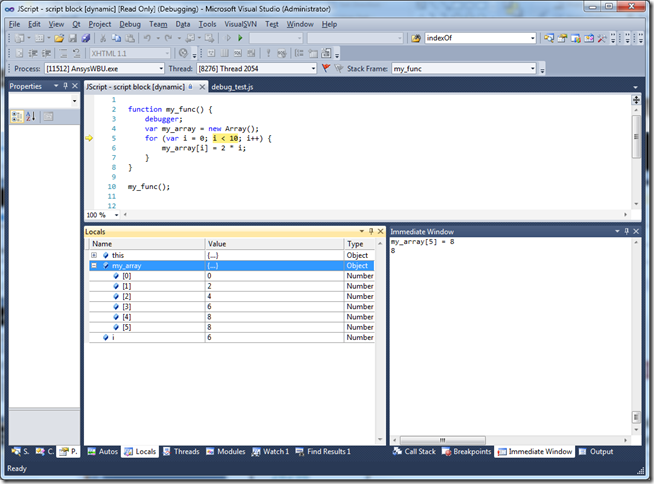
When I press return, this will execute that single line of code. You can see that my_array[5] now holds the value 8 instead of 10.
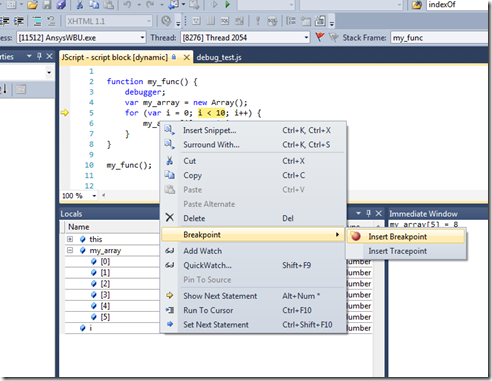
You can also set break points in your code. Just right click on the line, and choose Breakpoint->Insert Breakpoint
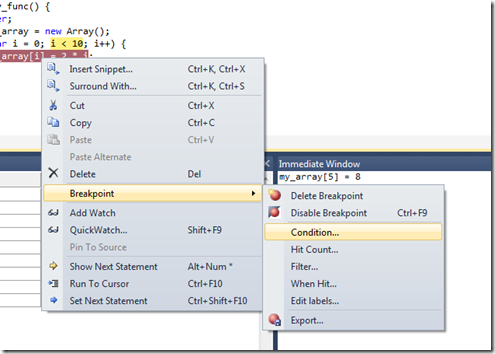
Breakpoints work kind of like the debugger command, only they don’t litter your code with commands. I usually insert one debugger command at the top of my script and then breakpoints where needed. Breakpoints can also be conditional. That is, they won’t break unless some condition is true. This is great for executing most of a loop, but breaking on the last or next to last item. After you have inserted a breakpoint, just right click on the line and choose Breakpoint->Condition…
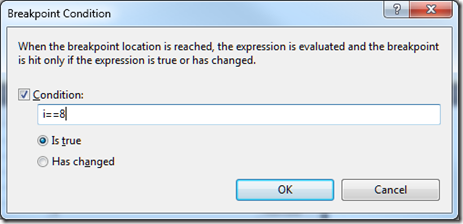
You can insert a condition like:
From here, press F5 which is the Run command, and the code will execute inside the loop until I == 8.
Conclusion
The debugger is your friend; plain and simple. Use it wisely and use it often. In fact, if you want to script in Mechanical, you are going to have to become intimately familiar with the debugger. In a future article, I will show you more powerful debugging tips when the debugger by itself lets you down. Stay tuned…

