Making Charts and Tables in ANSYS Mechanical

Categories:

image

One of the nicer features in ANSYS Mechanical is the fact that when you enter in any type of tabular data, or look at any type of tabular results, you can view it as a table or as a graph.  But what if you want to make your own graph, maybe even viewing values from two different solutions?  ANSYS Mechanical has a little used feature called “New Chart and Table” that will allow you to make a table or a graph (chart) of quantities in your model tree that make sense when displayed as a graph or table: Time, loads applied over time, and results over time.

image

I have found myself exporting data to excel and making graphs all the time. And this is OK if you just do it once. But if you make a change to the model, you need to export again and redo your graph.  The Chart and Table function makes this an automatic step, right there in your model tree.

For this posting, we will just use a simple plasticity bending example. We hold the bottom of a round bar with a grove cut in the bottom part and push on the top with forces.

In its simplest form the “Chart and Table” duplicates what you see in the graph and Tabular Data windows when you click on a load or a result. Here is what you get when you click on a displacement:

image

And if you select the probe in the tree and click on the “New Chart and Table” icon you get:

image

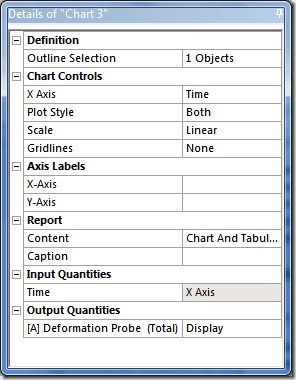
No woop.  But even if I want to just plot one value, I can now customize the look of the graph a bit.  Take a look at the Details for the Chart:
image

With the Chart Controls you can define what is shown on the X axis; if you want lines, points or both with Plot Style, log or linear scale, and if you want horizontal, vertical, neither, or both gridlines.

image

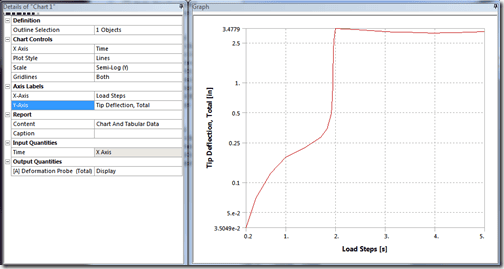
This is what it looks like if I turn on both gridlines and use a log scale for the Y Axis.

Next, we can add axis labels with “Axis Labels:”
image

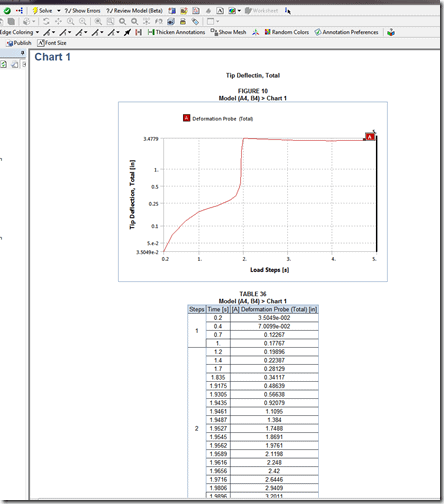
The “Report” Section tells the program what to do when a report is generated. By default you get a table and a graph.  But you can do either, both, or you can suppress it in the report.  You can give the plot and/or table in the report a caption by filling in the Caption field.  It comes out nice:
image

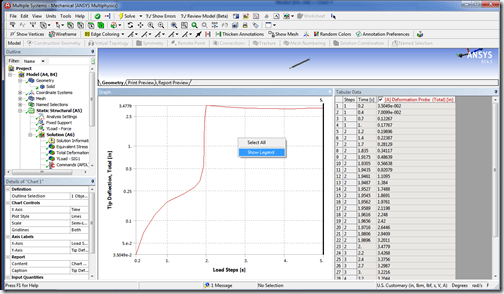
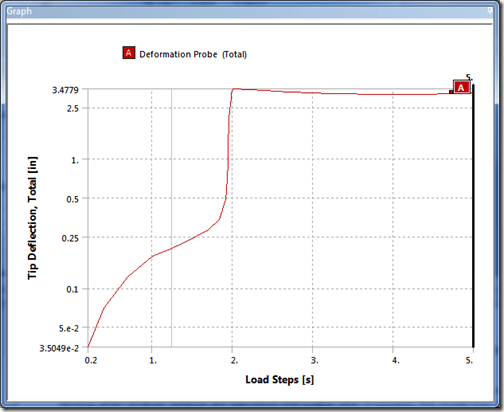
Note that it actually includes a legend in the report. If you want the legend when you are looking at a graph interactively, just Right Mouse Button on the graph and choose “Show Legend” to turn it on:
image

image

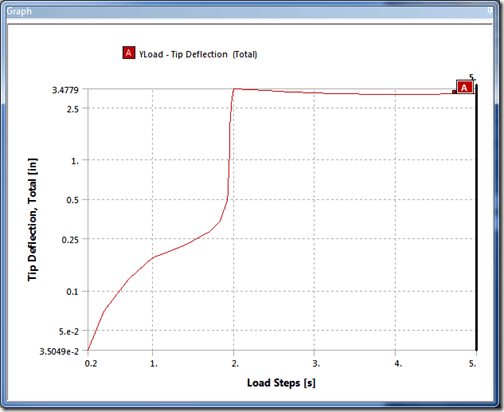
Note that the legend shows the name of the branch in the tree. That is not very informative. So I change it to something useful and now the legend is useful:
image

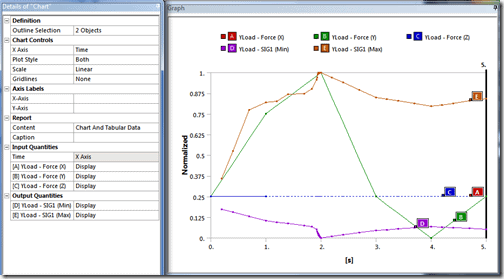
So even with a basic graph, we can do a lot. But the real power is when you want to look at more. Let’s say I want to plot the force and the stress over time. I create a new chart with the icon then select the force and the stress results as my “Outline Selection”
image

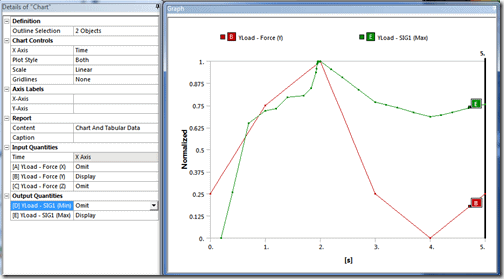
I get a lot of stuff on my graph. That is because the program starts by plotting all the components for the load, and all max and min stress over time for the result. I simply change the ones I don’t want from “Display” to “Omit.”  Then I get:
image

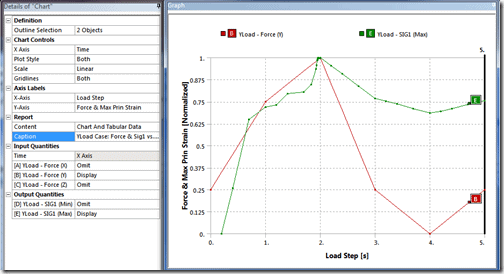
Much more useful.  Note that it does not create two separate Y axis. Instead it normalizes the values between the min and max for each. This is not ideal, and hopefully in the future they will support multiple axis, but it still works for most cases when you want to compare things. Note that I renamed the branches in my tree so they show up in the legend correctly.  Next I will add some labels and turn on gridlines.
image

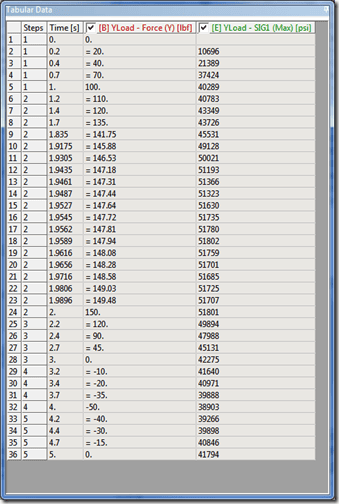
We have been neglecting the table. It also gets created:
image

As with any table in ANSYS Mechanical, it can be exported to Excel. So if you find yourself grabbing data from multiple input or result tables and pasted them into Excel, make a Chart and Table item to grab all the data you want in one place, then export it once.  To be honest, the quality of the graphs that are made are good enough for engineering, but maybe not good enough for a presentation. By making a Chart & Table of what you need, then exporting to Excel or some other graphing tool, you can still save a lot of time.

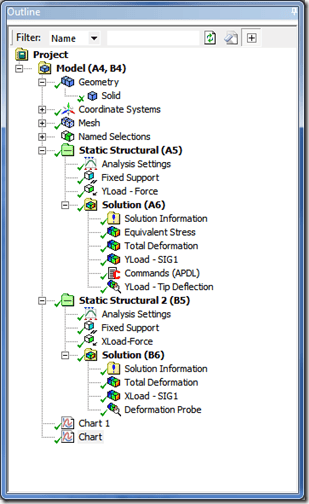
Next, let us look at plotting values from multiple simulations.  If you look at the tree, you will notice that the charts are a child of the model, not the simulations.  This signals that we can show data from the same model, but different simulations:
image

In our example I’ve simply made one with a tip force in the Y direction, and one with a tip force in the X direction. And I can show that by making a chart:
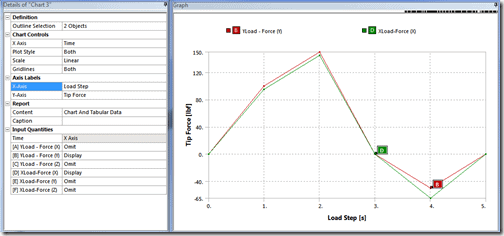
image

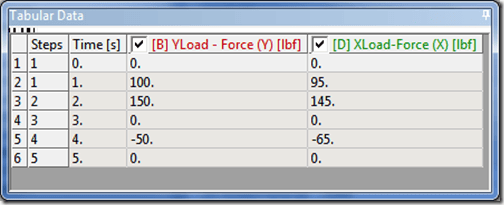
And I get a table:

image

HINT: If you want to make a single table or chart that shows all your input loads over time, in a single simulation or across multiple simulations, this is the way to do it.  If I add a third simulation where I vary the load in all three directions, I can capture all three cases in one table:

image

These examples show loads. Here is what it looks like if we review the deflection on the tip probe over time for two simulations:
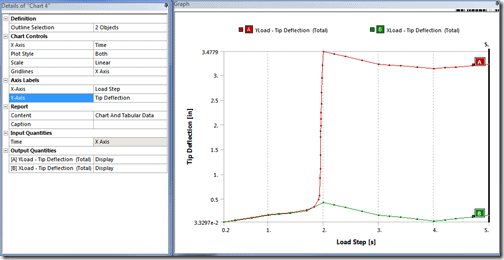
image

Or mash it all up, and show stress and deflection for both cases:
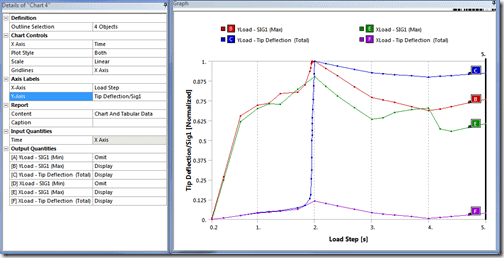
image

In every case so far we have used time (Load Step for static) as our X axis. But you can put any value you want on the X axis.  Here is Force applied vs Tip Deflection:
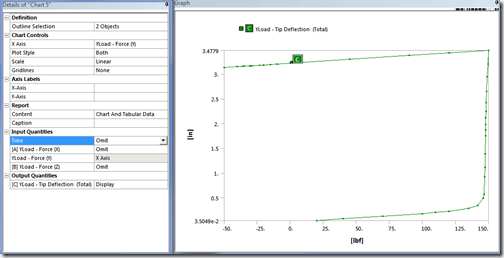
image

Make sure you turn off Time and loads you don’t want to see.  This is a great way to plot hysteresis effects.

You may notice the plots in this posting are nice and big and have a good aspect ratio. And your screen looks like this:
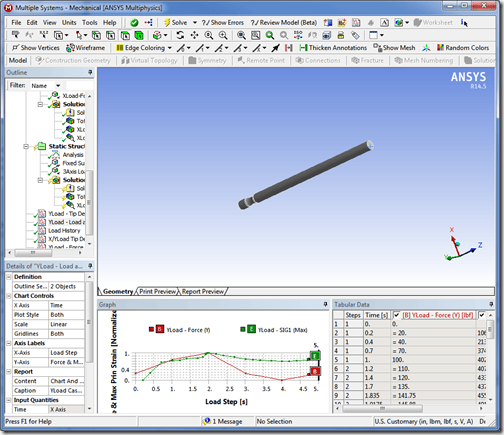
image

Every window in ANSYS Mechanical can be dragged out of the frame and positioned/sized however you want. So I pull off the Graph window by itself and resize it to the aspect ratio I want. Now when I want to save the image all I have to do is select that window and hit Alt-Print Screen. The image is now stored in the clipboard and I can paste it where I want.
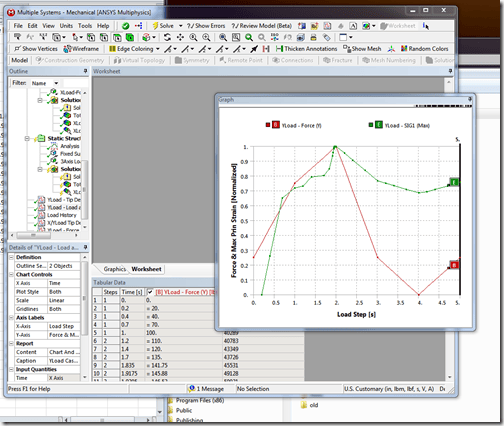
image

To get the normal window configuration back, click View>Windows>Reset Layout.

As always, play with it to figure more out. I’ve included my simple test case in case you want to play with it first:

Categories

Certified Elite Channel Partner

Get Your Ansys Products & Support from the Engineers who Contribute to this Blog.

Product Development
Platinum Partner

Technical Expertise to Enable your Addictive Manufacturing Success.

PADT’s Pulse Newsletter

Keep up to date on what is going on at PADT by subscribing to our newsletter.


By submitting this form, you are consenting to receive marketing emails from: Phoenix Analysis and Design Technologies, 7755 S. Research Dr., Tempe, AZ, 85284, https://www.padtinc.com. You can revoke your consent to receive emails at any time by using the SafeUnsubscribe® link, found at the bottom of every email. Emails are serviced by Constant Contact

Share this post:

Upcoming Events

03/22/2023

2023 Arizona MedTech Conference

03/22/2023

Optimize Jigs & Fixtures with Additive - Webinar

03/15/2023

3D Design Updates in Ansys 2023 R1 - Webinar

03/08/2023

Competitive Advantages of 1D/3D Coupled Simulation - Webinar

03/01/2023

High Frequency Updates in Ansys 2023 R1 - Webinar

02/22/2023

Additive Advantages in Aerospace - Webinar

02/15/2023

Structural Updates in Ansys 2023 R1 (1) - Webinar

02/09/2023

IME 2023: MD&M | WestPack | ATX | D&M | Plastek

02/08/2023

IME 2023 MD&M | WestPack | ATX | D&M | Plastek

02/07/2023

IME 2023 MD&M | WestPack | ATX | D&M | Plastek

01/27/2023

Arizona Photonics Days, 2023

01/26/2023

Arizona Photonics Days, 2023

01/26/2023

TIPE 3D Printing | 2023

01/26/2023

Venture Cafe Phoenix Talent Night - Job Fari

01/26/2023

VFS 2023 Autonomous/Electric VTOL Symposium

01/25/2023

Arizona Photonics Days, 2023

01/25/2023

Building A.M.- Utah: Kickoff!

01/25/2023

TIPE 3D Printing | 2023

01/25/2023

VFS 2023 Autonomous/Electric VTOL Symposium

01/24/2023

VFS 2023 Autonomous/Electric VTOL Symposium

01/24/2023

TIPE 3D Printing | 2023

01/18/2023

2023 AZ Tech Council Golf Tournament

12/21/2022

Simulation Best Practices for 5G Technology - Webinar

12/14/2022

Digital Twins Updates in Ansys 2022 R2 - Webinar

12/08/2022

Tech the Halls - AZ Tech Council Holiday Mixer

12/07/2022

Electric Vehicle and Other Infrastructure Update Panel

11/30/2022

SPEOS Updates in Ansys 2022 R2 - Webinar

11/23/2022

Simulation Best Practices for Electronics Reliability - Webinar

11/16/2022

Discovery Updates in Ansys 2022 R2

11/10/2022

VentureCafe Phoenix Panel: Venture Capital in AZ

11/08/2022

2022 GOVERNOR’S CELEBRATION OF INNOVATION AWARDS + TECH SHOWCASE

11/03/2022

VentureCafe Phoenix Panel: Angel Investment in AZ

11/02/2022

High & Low Frequency Electromagnetics Updates in Ansys 2022 R2

10/26/2022

Simulation Best Practices For Chip-Package-System Design & Development

10/20/2022

Nerdtoberfest 2022

10/19/2022

2022 Southern Arizona Tech + Business Expo

10/19/2022

LS-DYNA Updates in Ansys 2022 R2 - Webinar

10/17/2022

Experience Stratasys Truck Tour - Clearfield Utah

10/14/2022

ASU School of Manufacturing Systems and Networks - Formal Opening Cele

10/14/2022

Experience Stratasys Truck Tour - Midvale Utah

10/12/2022

Experience Stratasys Truck Tour - Littleton Colorado

10/06/2022

Fluids Updates in Ansys 2022 R2 - Webinar

10/05/2022

Experience Stratasys Truck Tour - Colorado Springs

09/29/2022

White Hat Life Science Investor Conference - 2022

09/28/2022

2022 AZBio Awards

09/28/2022

Simulation Best Practices for Rotating Machinery Design & Development

09/21/2022

ExperienceIT NM 2022

09/21/2022

Additive Updates in Ansys 2022 R2 - Webinar

09/14/2022

Rocky Mountain Life Sciences Investor & Partnering Conference

09/08/2022

Ansys Optics Simulation User Group Meeting - Virtual

09/08/2022

Ansys Optics Simulation User Group Meeting

09/07/2022

SI & PI Updates in Ansys 2022 R2 - Webinar

08/31/2022

Simulation Best Practices for Developing Medical Devices - Webinar

08/24/2022

Mechanical Updates in Ansys 2022 R2 - Webinar

08/10/2022

Tucson after5 Tech Mixer: Ruda-Cardinal

08/05/2022

Flagstaff Tech Tour, 2022

08/02/2022

2022 CEO Leadership Retreat

08/01/2022

2022 CEO Leadership Retreat

07/27/2022

Thermal Integrity Updates in Ansys 2022 R1 - Webinar

07/20/2022

Simulation Best Practices for the Pharmaceutical Industry - Webinar

07/14/2022

NCMS Technology Showcase: Corpus Christi Army Depot

07/13/2022

NCMS Technology Showcase: Corpus Christi Army Depot

07/13/2022

Additive & Structural Optimization Updates in Ansys 2022 R1 - Webinar

07/07/2022

Arizona AADM Conference, 2022

06/29/2022

LS-DYNA Updates & Advancements in Ansys 2022 R1 - Webinar

06/23/2022

Simulation Best Practices for Wind Turbine Design - Webinar

06/15/2022

MAPDL Updates & Advancements in Ansys 2022 R1 - Webinar

06/01/2022

Mechanical Updates in Ansys 2022 R1 - pt. 2 Webinar

05/26/2022

Modelling liquid cryogenic rocket engines in Flownex - Webinar

05/25/2022

SMR & Advanced Reactor 2022

05/25/2022

05/24/2022

SMR & Advanced Reactor 2022

05/19/2022

RAPID + tct 2022

05/19/2022

Venture Cafe Roundtable: AI & Healthcare

05/18/2022

Tucson after5 Tech Mixer: World View

05/18/2022

RAPID + tct 2022

More Info

05/18/2022

Signal & Power Integrity Updates in Ansys 2022 R1 - Webinar

05/18/2022

Simulation World 2022

05/17/2022

RAPID + tct 2022

05/11/2022

Experience Stratasys Manufacturing Virtual Event

05/04/2022

Mechanical Meshing Updates in Ansys 2022 R1 - Webinar

04/27/2022

04/22/2022

12TH ANNUAL TUCSON GOLF TOURNAMENT

04/21/2022

04/20/2022

Additional Fluids Updates in Ansys 2022 R1

04/20/2022

Experience Stratasys Tour – Tempe Arizona

04/18/2022

Experience Stratasys Tour - Flagstaff Arizona

04/14/2022

D&M West | MD&M West

04/13/2022

D&M West | MD&M West

04/13/2022

Experience Stratasys Tour - Albuquerque New Mexico

04/12/2022

D&M West | MD&M West

04/12/2022

Experience Stratasys Tour - Los Alamos New Mexico

04/12/2022

Optimizing Engineering Workflows f​​​​or Propulsion System Design

04/07/2022

Experience Stratasys Tour - Austin Texas

04/07/2022

37th Space Symposium - Arizona Space Industry

04/06/2022

Transforming Digital Engineering with Ansys Discovery 2022 R1

04/06/2022

37th Space Symposium - Arizona Space Industry

04/05/2022

37th Space Symposium - Arizona Space Industry

04/04/2022

37th Space Symposium - Arizona Space Industry

Search in PADT site

Contact Us

Most of our customers receive their support over the phone or via email. Customers who are close by can also set up a face-to-face appointment with one of our engineers.

For most locations, simply contact us: