Have you ever looked at the mechanical properties in an FDM material datasheet (one example shown below for Stratasys ULTEM-9085) and wondered why properties were prescribed in the non-traditional manner of XZ and ZX orientation? You may also have wondered, as I did, whatever happened to the XY orientation and why its values were not reported? The short (and unfortunate) answer is you may as well ignore the numbers in the datasheet. The longer answer follows in this blog post.

Mesostructure has a First Order Effect on FDM Properties
In the context of FDM, mesostructure is the term used to describe structural detail at the level of individual filaments. And as we show below, it is the most dominant effect in properties.
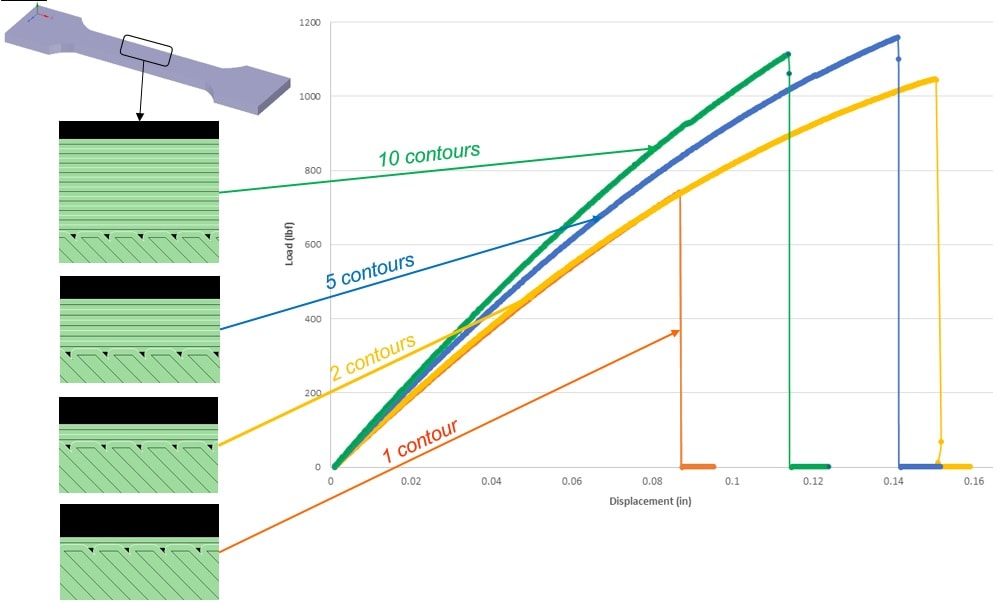
Consider this simple experiment we did a few months ago: we re-created the geometry used in the tensile test specimens reported in the datasheets and printed them on our Fortus 400mc 3D printer with ULTEM-9085. While we kept layer thickness identical throughout the experiment (0.010″), we modified the number of contours: from the default 1-contour to 10-contours, in 4 steps shown in the curves below. We used a 0.020″ value for both contour and raster widths. Each of these samples was tested mechanically on an INSTRON 8801 under tension at a displacement rate of 5mm/min.
As the figure below shows, the identical geometry had significantly different load-displacement response – as the number of contours grew, the sample grew stiffer. The calculated modulii were in the range of 180-240 kpsi. These values are lower than those reported in datasheets, but closer to published values in work done by Bagsik et al (211-303 kpsi); datasheets do not specify the meso-structure used to construct the part (number of contours, contour and raster widths etc.). Further, it is possible to modify process parameters to optimize for a certain outcome: for example, as suggested by the graph below, an all-contour design is likely to have the highest stiffness when loaded in tension.
Can we Borrow Ideas from Micromechanics Theory?
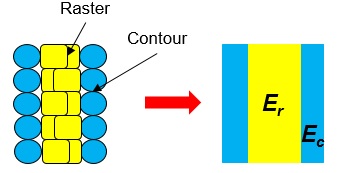
The above result is not surprising – the more interesting question is, could we have predicted it? While this is not a composite material, I wondered if I could, in my model, separate the contours that run along the boundary from the raster, and identify each as it’s own “material” with unique properties (Er and Ec). Doing this allows us to apply the Rule of Mixtures and derive an effective property. For the figure below, the effective modulus Eeff becomes:
Eeff = f.Ec + (1-f).Er
where f represents the cross-sectional area fraction of the contours.
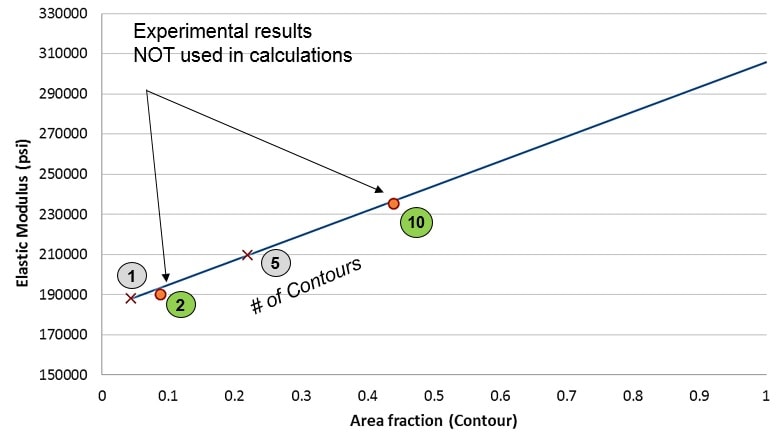
With four data points in the curve above, I was able to use two of those data points to solve the above equation simultaneously and derive Er and Ec as follows:
Er = 182596 psi
Ec = 305776 psi
Now the question became: how predictive are these values of experimentally observed stiffness for other combinations of raster and contours? In a preliminary evaluation for two other cases, the results look promising.
So What About the Orientation in Datasheets?
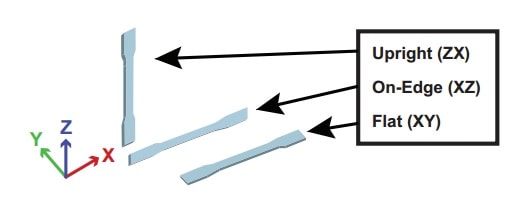
Below is a typical image showing the different orientations data are typically attributed to. From our micromechanics argument above, the orientation is not the correct way to look at this data. The more pertinent question is: what is the mesostructure of the load-bearing cross-section? And the answer to the question I posed at the start, as to why the XY values are not typically reported, is apparent if you look at the image below closely and imagine the XZ and XY samples being tested under tension. You will see that from the perspective of the load-bearing cross-section, XY and XZ effectively have the similar (not the same) mesostructure at the load-bearing cross-sectional area, but with a different distribution of contours and rasters – these are NOT different orientations in the conventional X-Y-Z sense that we as users of 3D printers are familiar with.
Conclusion
The point of this preliminary work is not to propose a new way to model FDM structures using the Rule of Mixtures, but to emphasize the significance of the role of the mesostructure on mechanical properties. FDM mesostructure determines properties, and is not just an annoying second order effect. While property numbers from datasheets may serve as useful insights for qualitative, comparative purposes, the numbers are not extendable beyond the specific process conditions and geometry used in the testing. As such, any attempts to model FDM structure that do not account for the mesostructure are not valid, and unlikely to be accurate. To be fair to the creators of FDM datasheets, it is worth noting that the disclaimers at the bottom of these datasheets typically do inform the user that these numbers “should not be used for design specifications or quality control purposes.”
If you would like to learn more and discuss this, and other ideas in the modeling of FDM, tune in to my webinar on June 28, 2016 at 11am Eastern using the link here, or read more of my posts on this subject below. If you are reading this post after that date, drop us a line at info@padtinc.com and cite this post, or connect with me directly on LinkedIn.
Thanks for reading!
~


