This post is the first of six on what I’ve learned after fiddling around for a while. It is an update to an article I did back in 2009 on the same topic, as well as plotting well in Mechanical APDL.
An update on outputting results in Ansys Mechanical:
Getting high-quality Pixels in Ansys Mechanical
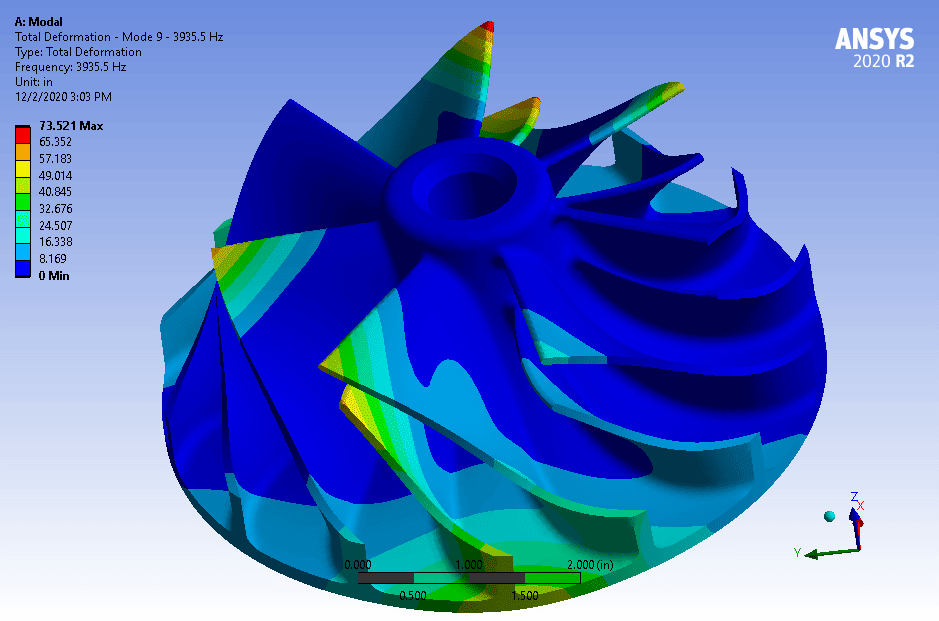
To get started, let’s meet our sample model, an impeller we were working with a while ago for some Additive Manufacturing simulation. The modal results are good for exploring plotting:

Getting an image file in Ansys Mechanical is pretty simple. You click on the object you want a plot of, then select Home > Insert > Images > “Image to File …”

The default preferences are good for most plots. You basically get what you see on the screen.
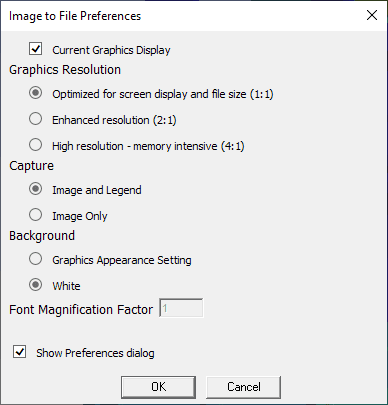
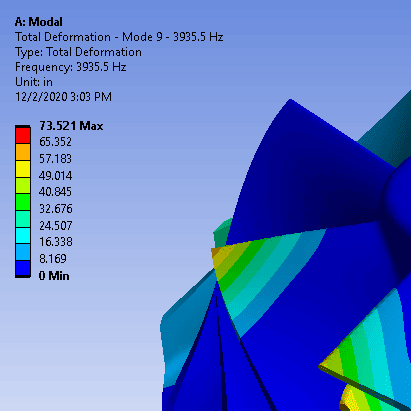
This is the dialog where we can start making some simple modifications to increase the quality. here is how it comes out. Click to see full size:
I’m not a big fan of that. It is OK for sticking in an email or small on a PowerPoint. But I like better resolution, not just for marketing, but also to allow zooming.
The simplest change is to up the resolution – the number of dots per inch. First, you have to unclick the “Current Graphics Display.”
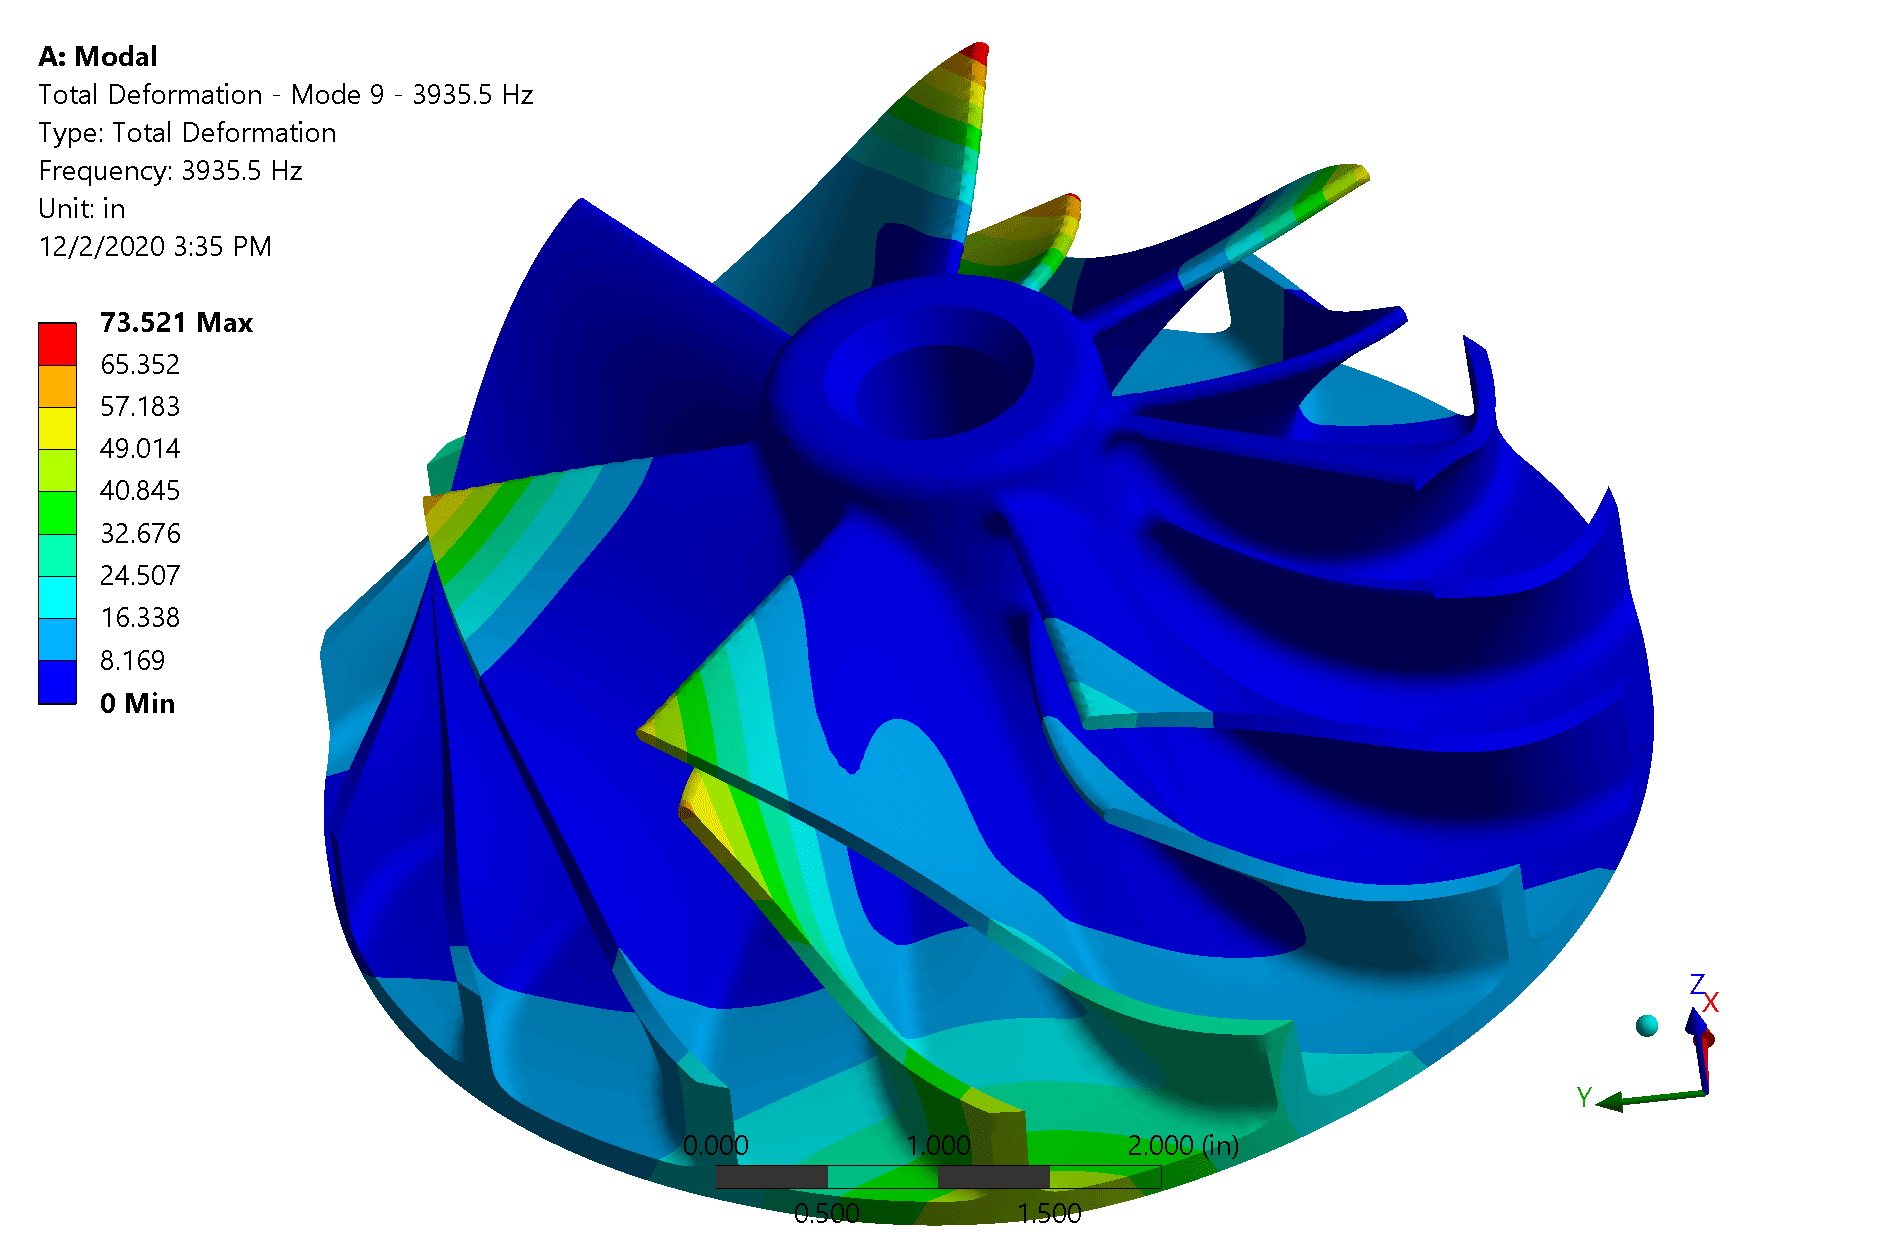
Playing with the resolution, here is the same image at the three different resolutions (1:1, 2:1, 4:1) (click to see it full size or look at the zoomed views below)
For most uses, the middle image, 2:1 is good enough. Image quality is driven by the number of color dots, or pixels. The base size is determined by how big the window is on your monitor. For this part the images are:
| Scale | Pixel Size | File Size |
| 1:1 | 939 x 621 | 140 KB |
| 2:1 | 878 x 1242 | 349 KB |
| 4:1 | 3756 x 2484 | 884 KB |
But if we zoom in we can see the difference. You really only need the 4:1 for printing, or as we needed, the ability to blow it up for a booth or banner.
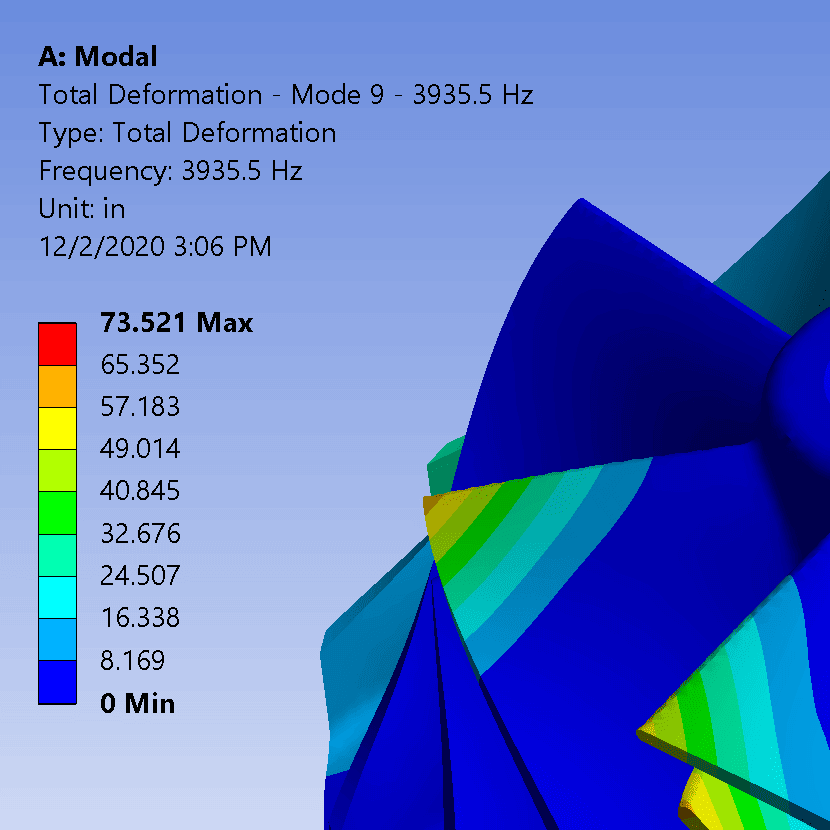
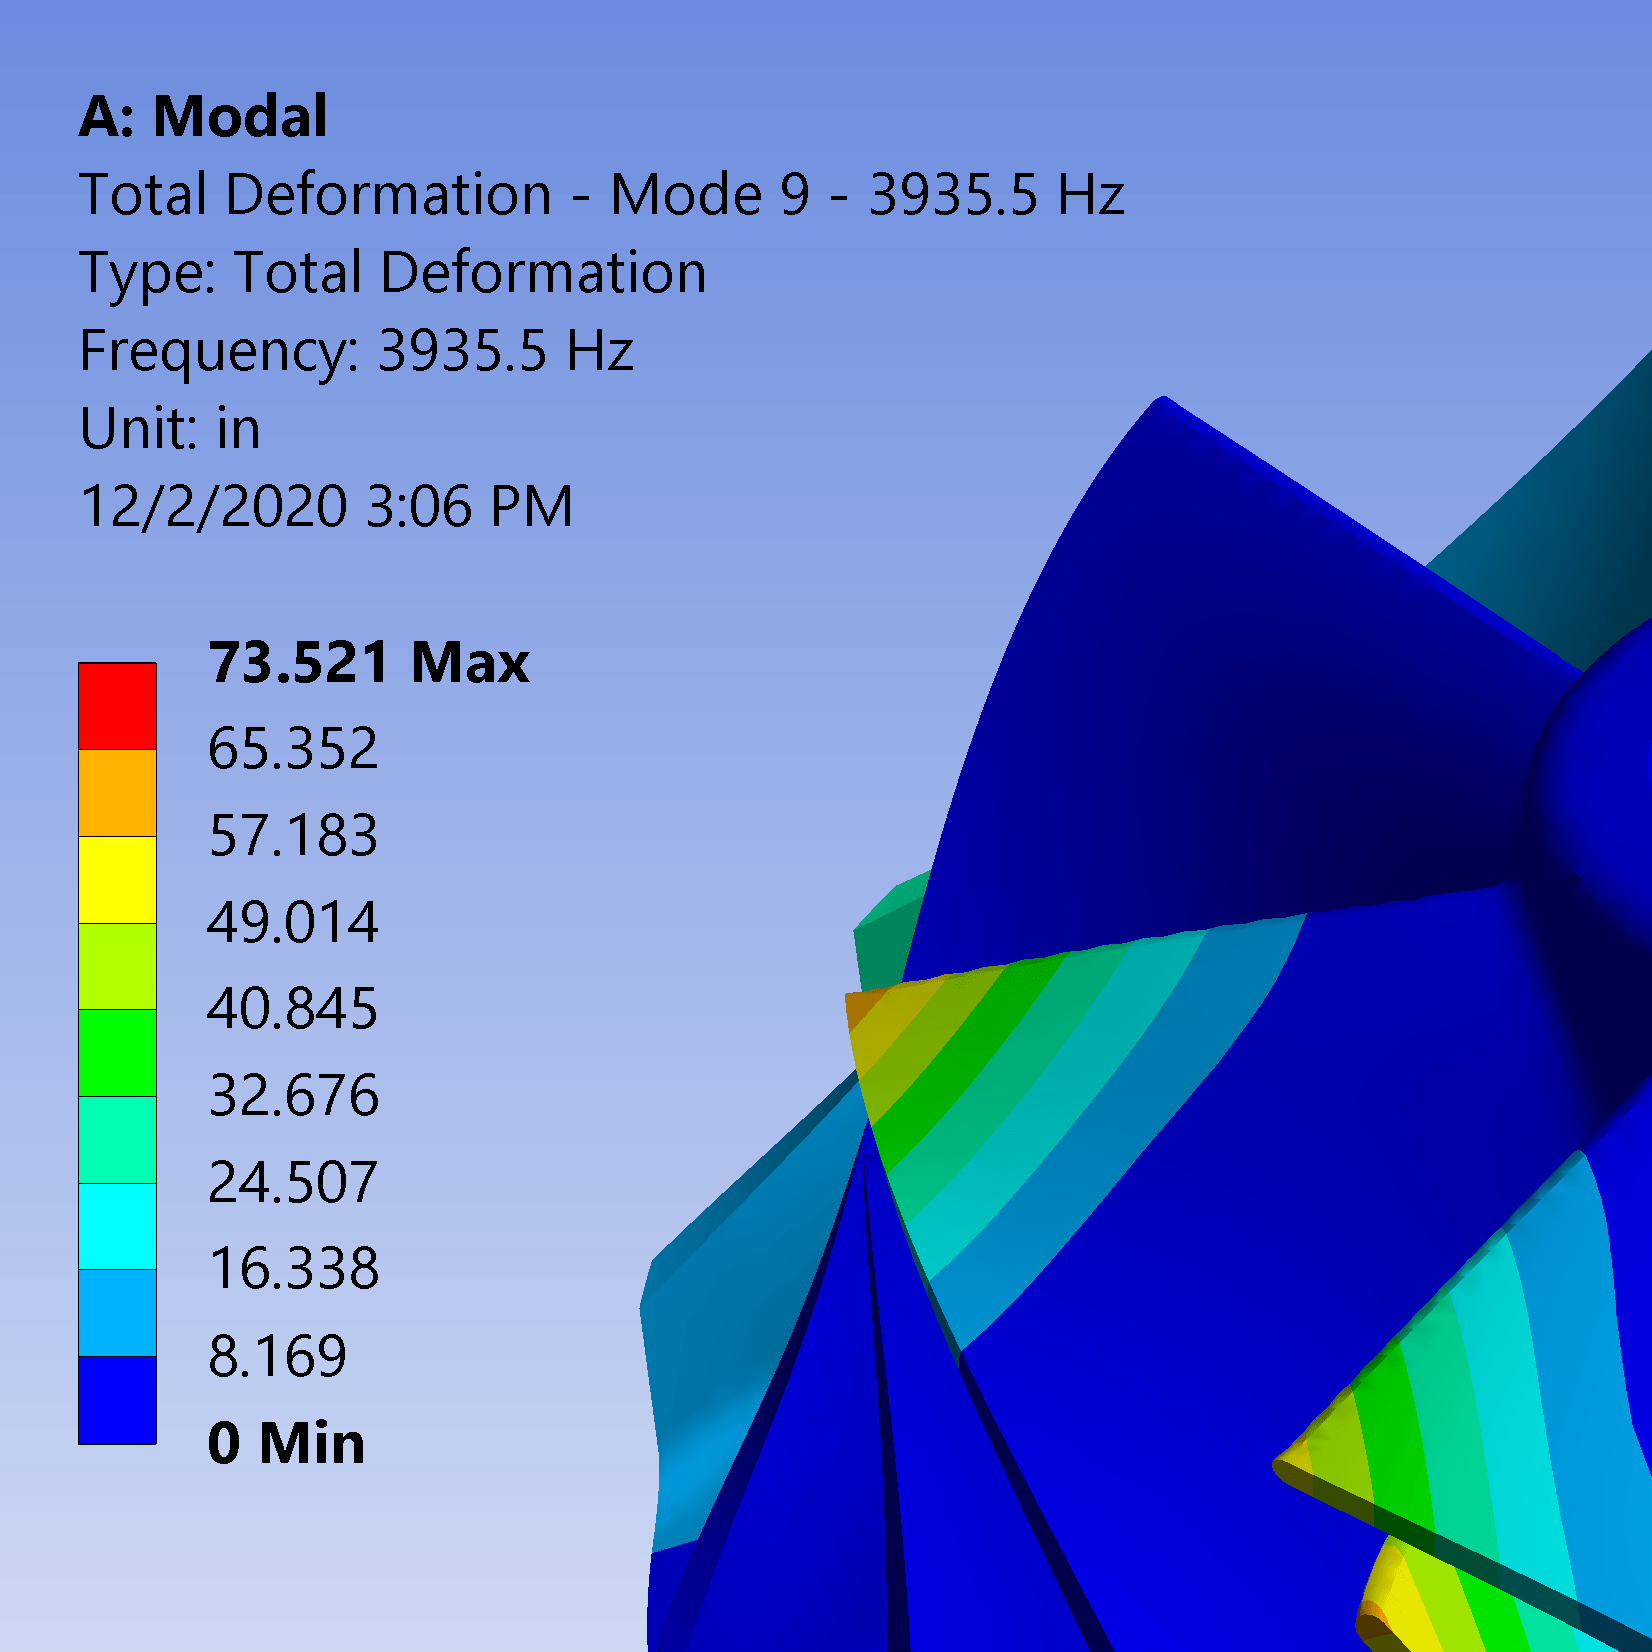
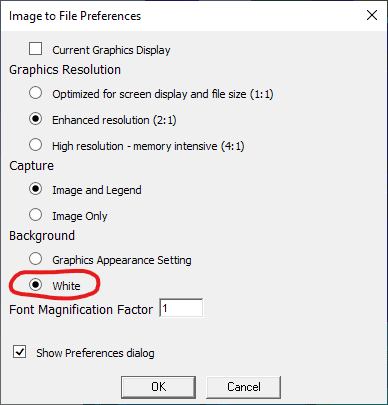
The blue-to-white gradient looks good on the screen and cuts down on eye fatigue, but can be a pain for images, especially if you are removing backgrounds or pasting into other documents. So the next thing I always do is change the background to white:
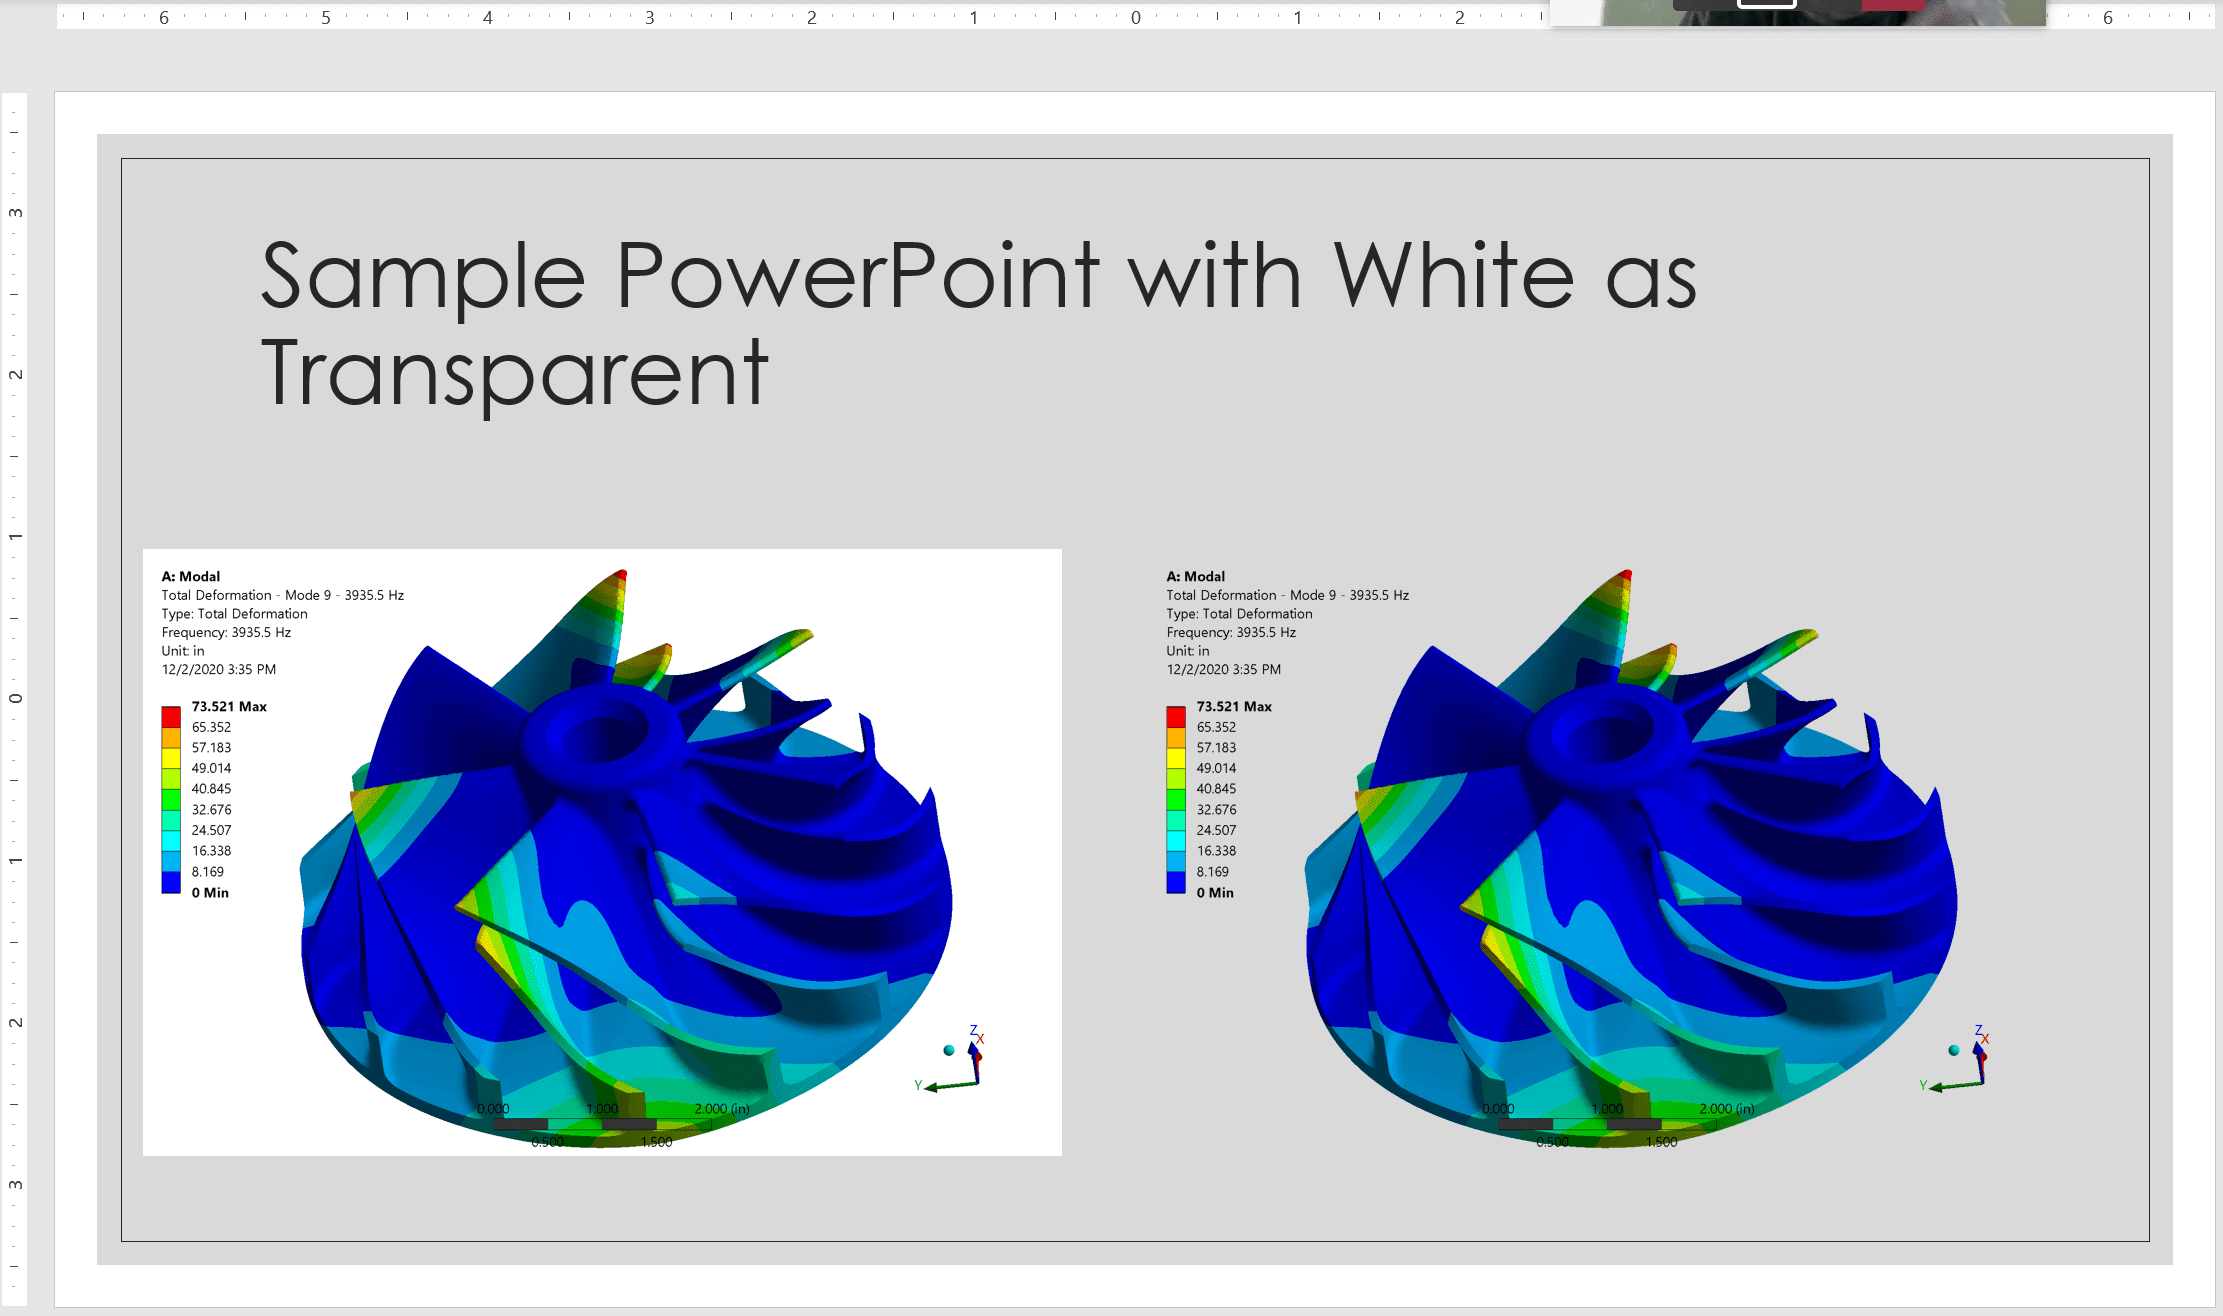
And you get a great picture, here it is 2:1, white background:
With the white background, it is easy to remove it, so you can place things behind it. That is very handy in PowerPoint.
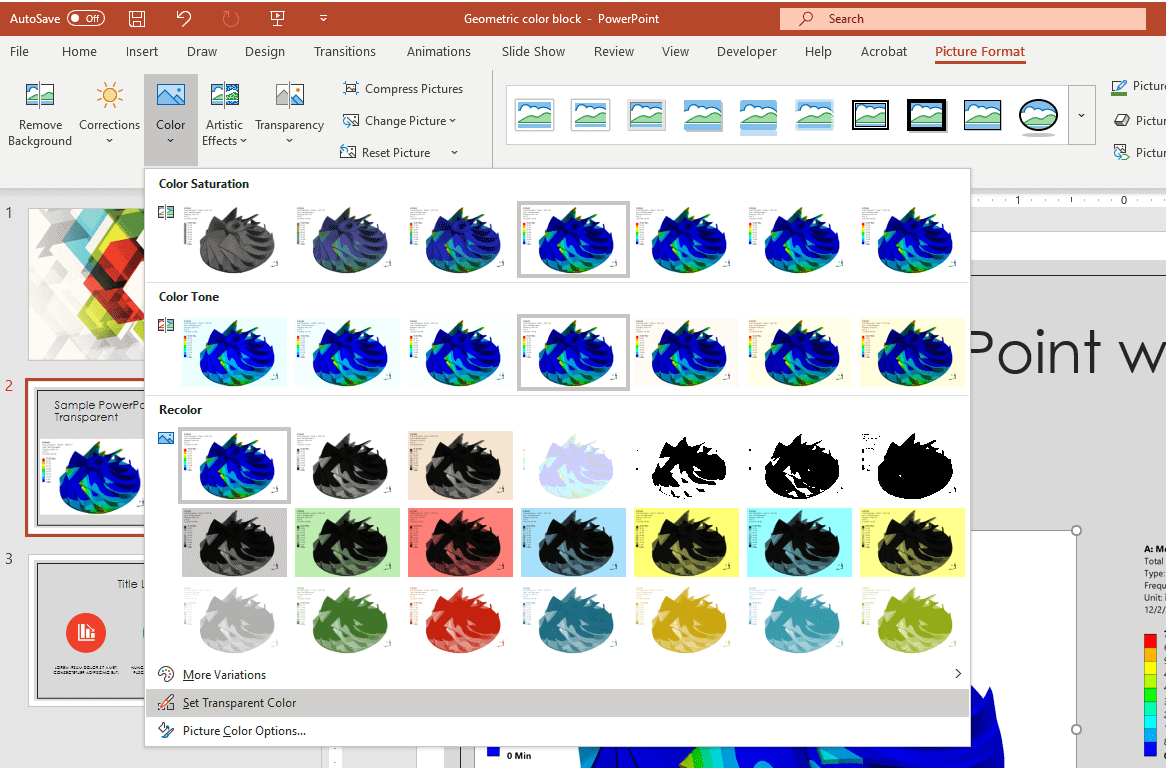
If you are not familiar with that feature in Microsft Office applications, it is under: Picture Format > Adjust > Color > Set Transparent Color. Then click on a white pixel in your image.
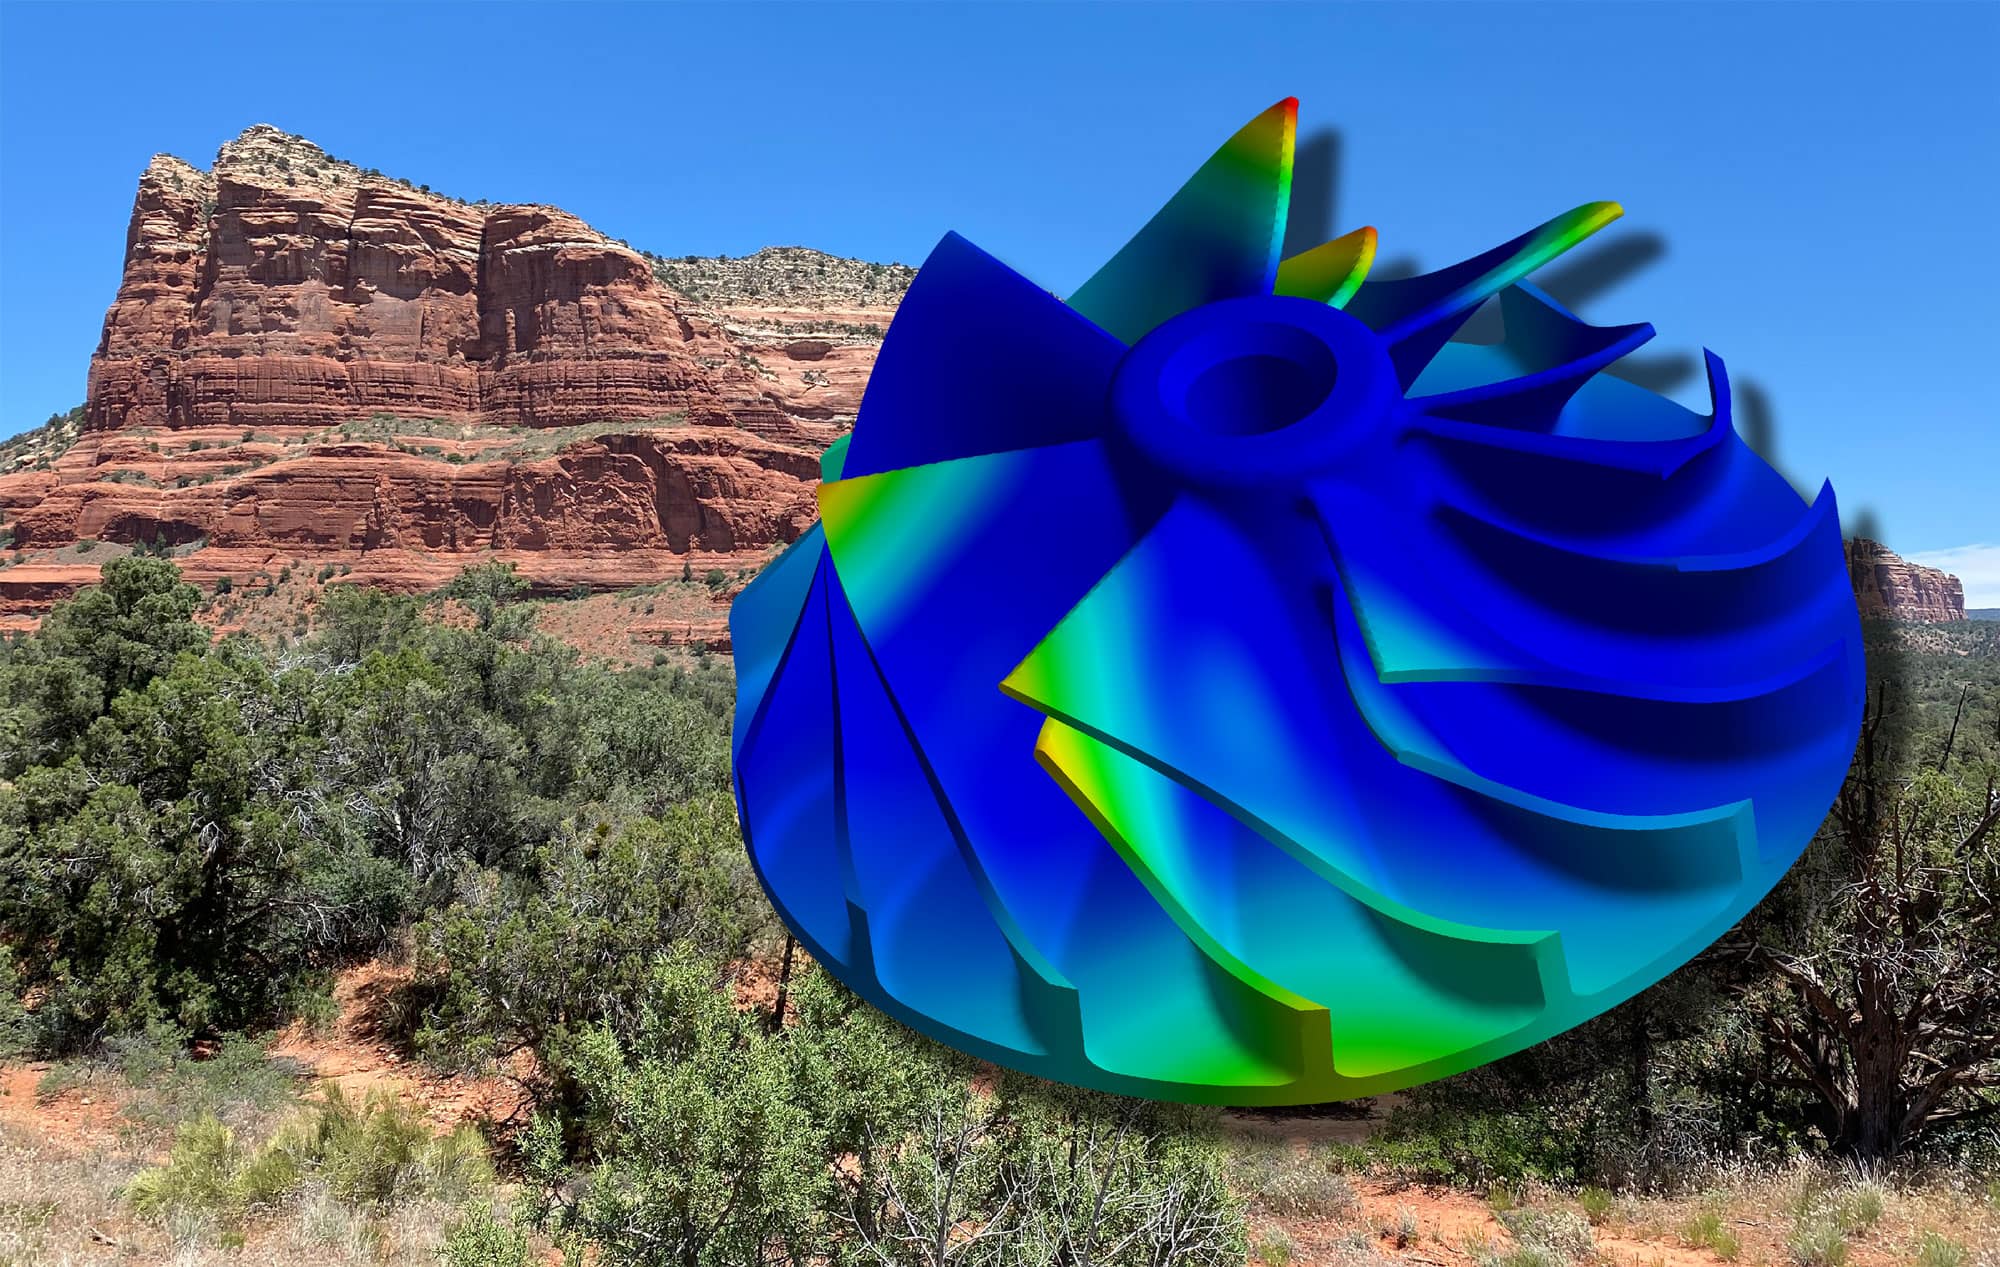
This example shows a gray background, but it works with much fancier backgrounds. Here is the impeller in Sedona, Arizona.

I deleted the white background, the key, and the triad in Photoshop. I usually turn off the scale and triad in Ansys Mechanical: Display > Show then pick what you want on your plot.

These plots all use solid colors for each contour band, which is easier to read if you are doing actual engineering. But if we are making marketing plots, I swap to smooth contours: Result > Display > Contours > Smooth Contours.

With a little Photoshop work you can get something pretty snazzy:
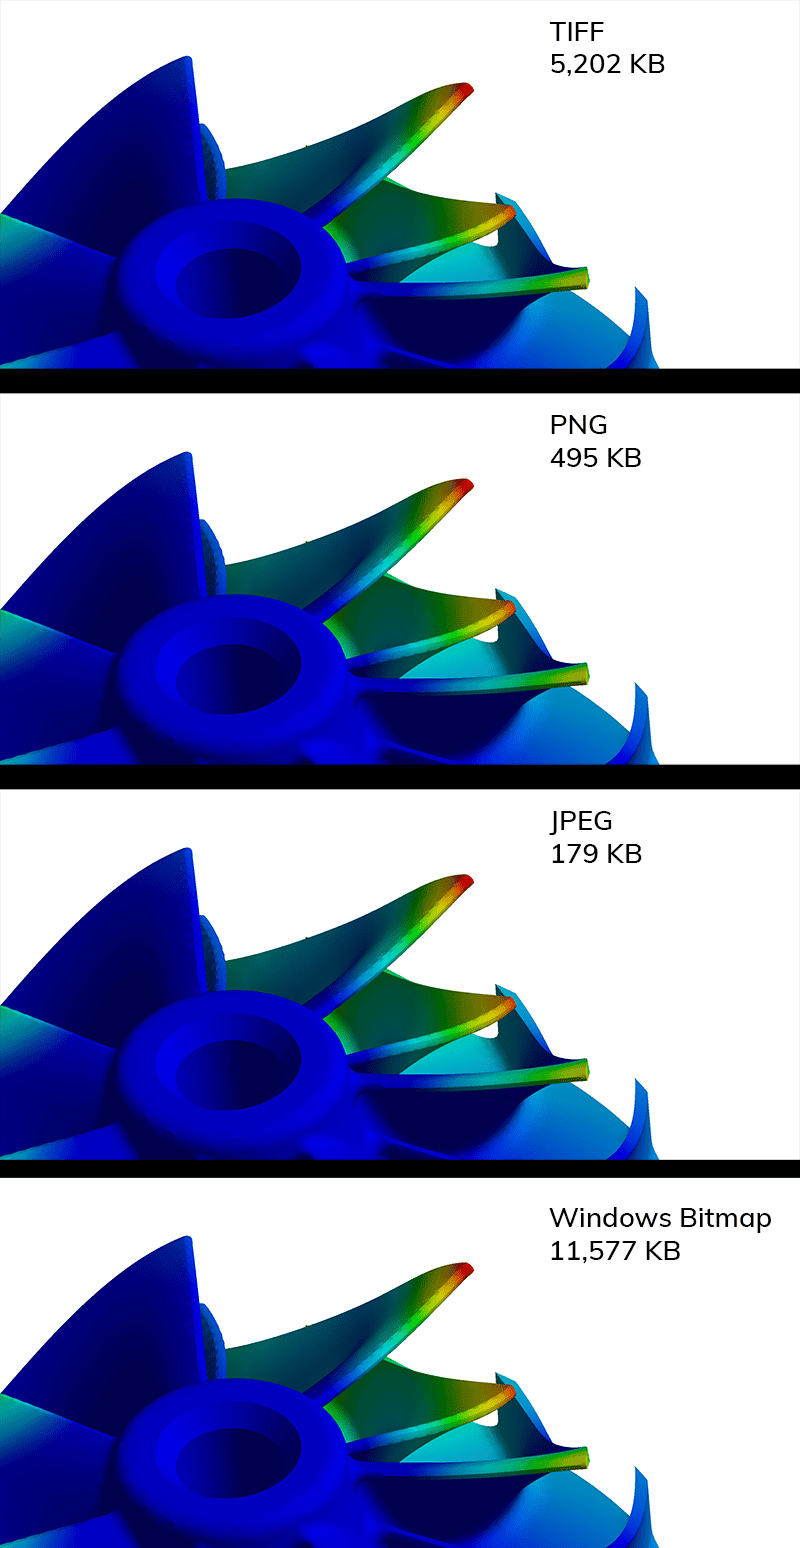
The last thing to talk about is what format to save in. This used to make a big difference because some of the formats traded quality for file size. But now the quality of the more efficient files is good.
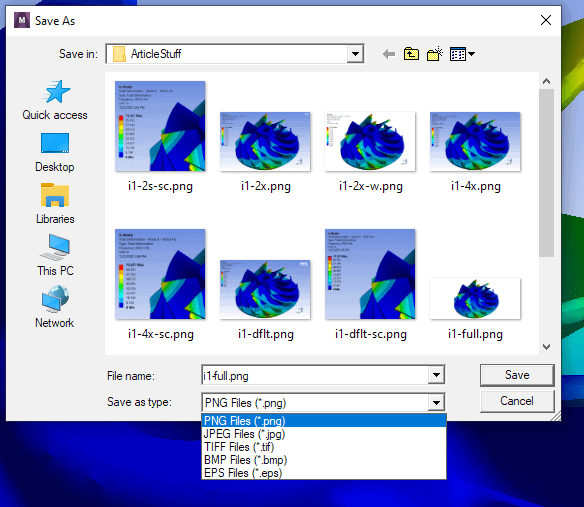
You chose the format when you specify the file name. The choices are PNG, JPEG, TIFF, Windows Bitmap, and EPS.
As you can see in the closeup below, the different formats really don’t lose quality, but their size varies a lot. Take a look at the next image, I can’t spot the difference. I recommend PNG because it is small but doesn’t lose any quality. But if you have a lot of plots and size is an issue, use JPEG. I have no idea why TIFF and especially Windows Bitmap or so large, but unless someone asks you for those formats, I’d avoid them.
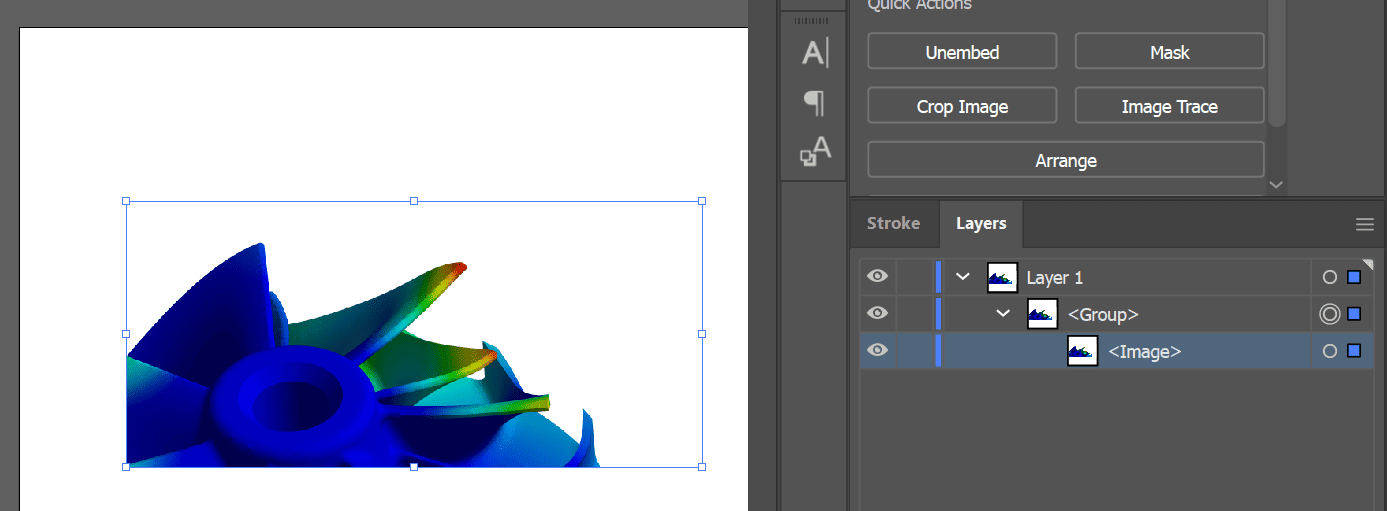
Which leads us to the EPS or Encapsulated Postscript format. This is the last option. Now, EPS is usually what we call a vector format – not pixels but actual shaded polygons. The advantage of vector is that you can scale it up and down all you want and nothing is lost. The image is always sharp.
So you may get excited when you see EPS. In Ansys Mechanical APDL it does create a vector file (a way to get vector graphics of your results if you need them. Use /show,PSCR,,,8) But Ansys Mechanical just creates a bitmap image and puts it into Postscript format. It is not vector. You can see this if you open it in Adobe Illustrator. Bummer.
I hope this helps, and for 90% of your plotting needs, these tips should get the job done. But if you want to go further, read on to the next post in the series: “2 – An update on outputting results in Ansys Mechanical: Taking it to the Next Level with Ansys EnSight“

