Friday Flownex Tech Tips #11
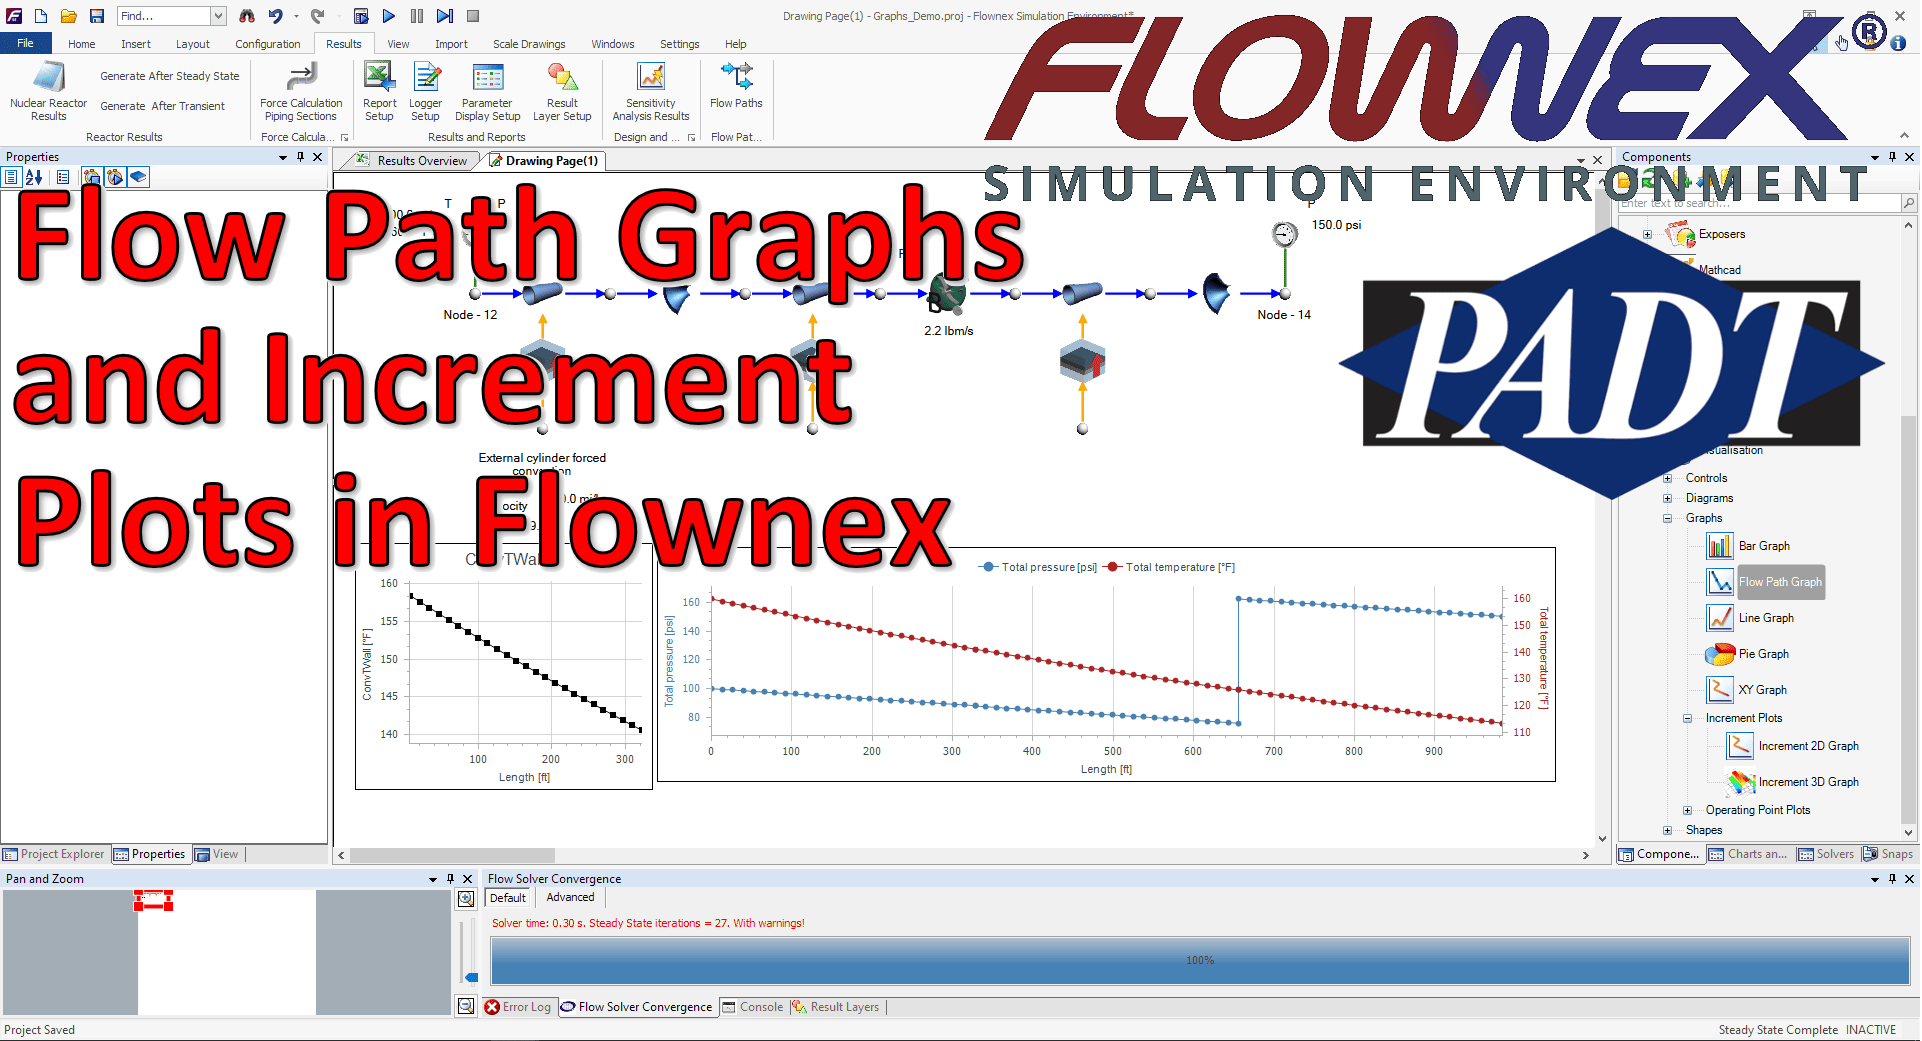
Flow Path Graphs and Increment Plots can be incredibly useful visualization tools to see how a simulation result varies as a function of length along the axial flow path and to see a higher fidelity result for a single flow component. Use these in Flownex to up your reporting game! In this demo we are using Flownex version 8.12.7.4334
Creating a Flow Path
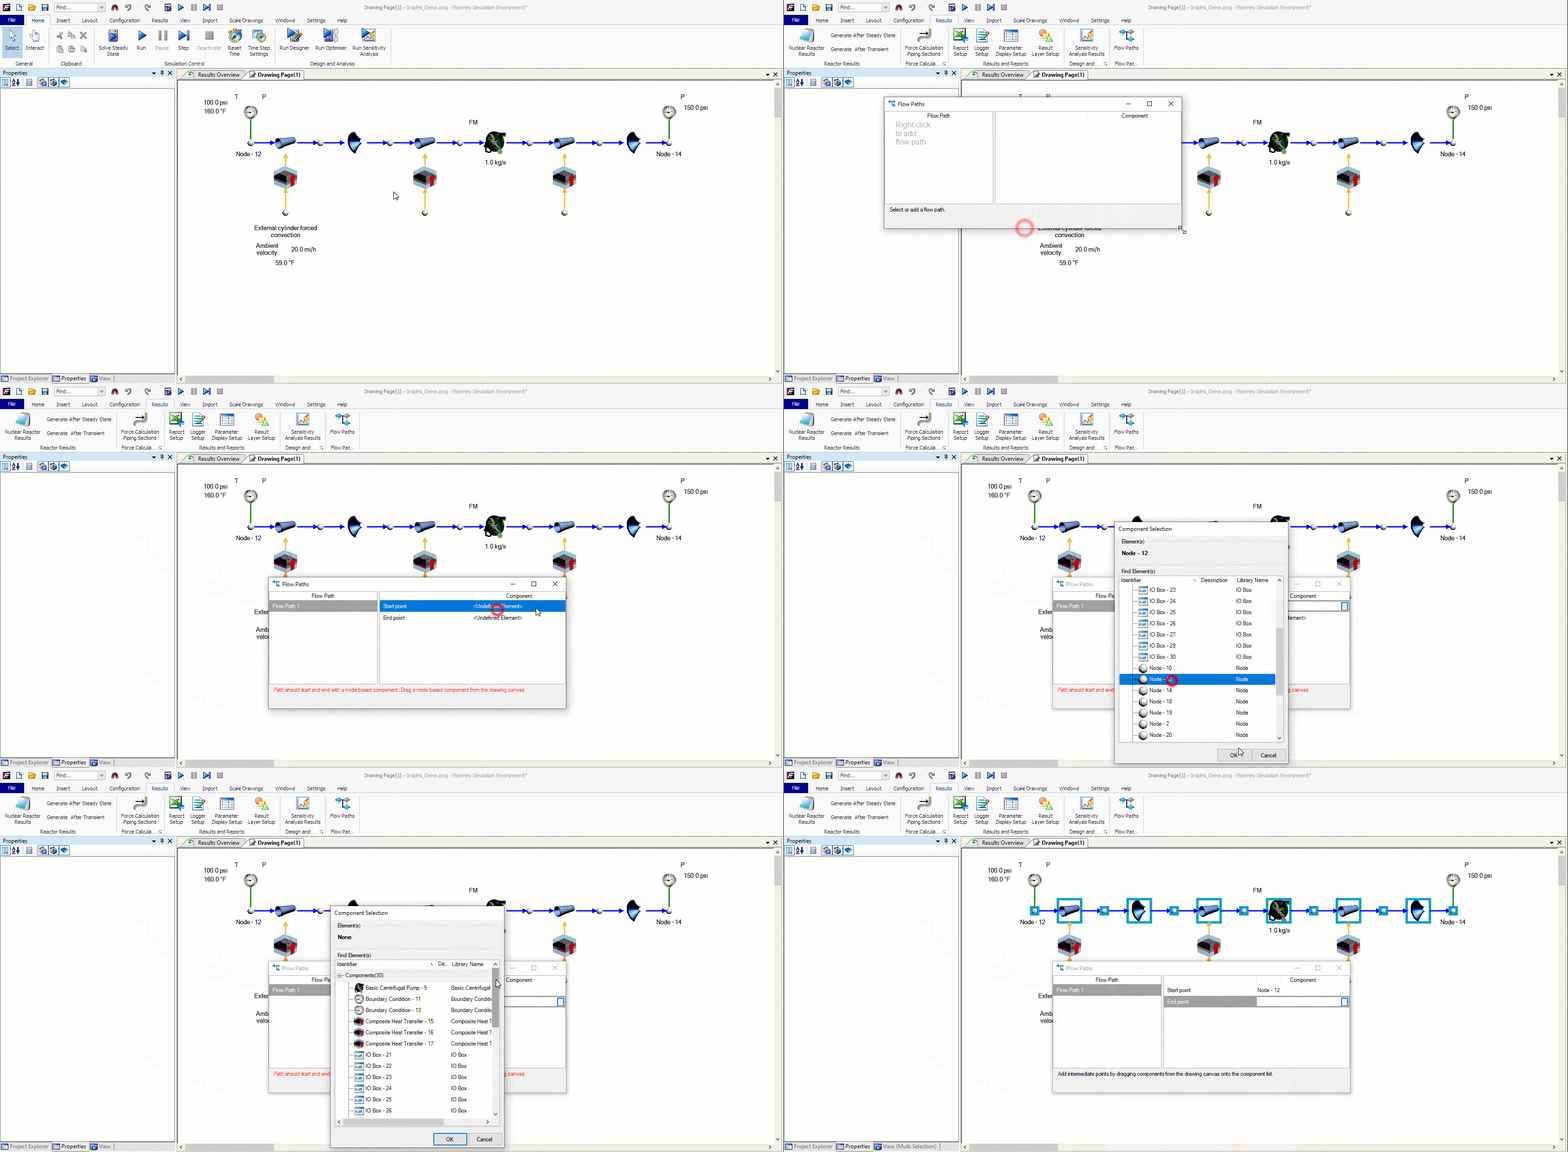
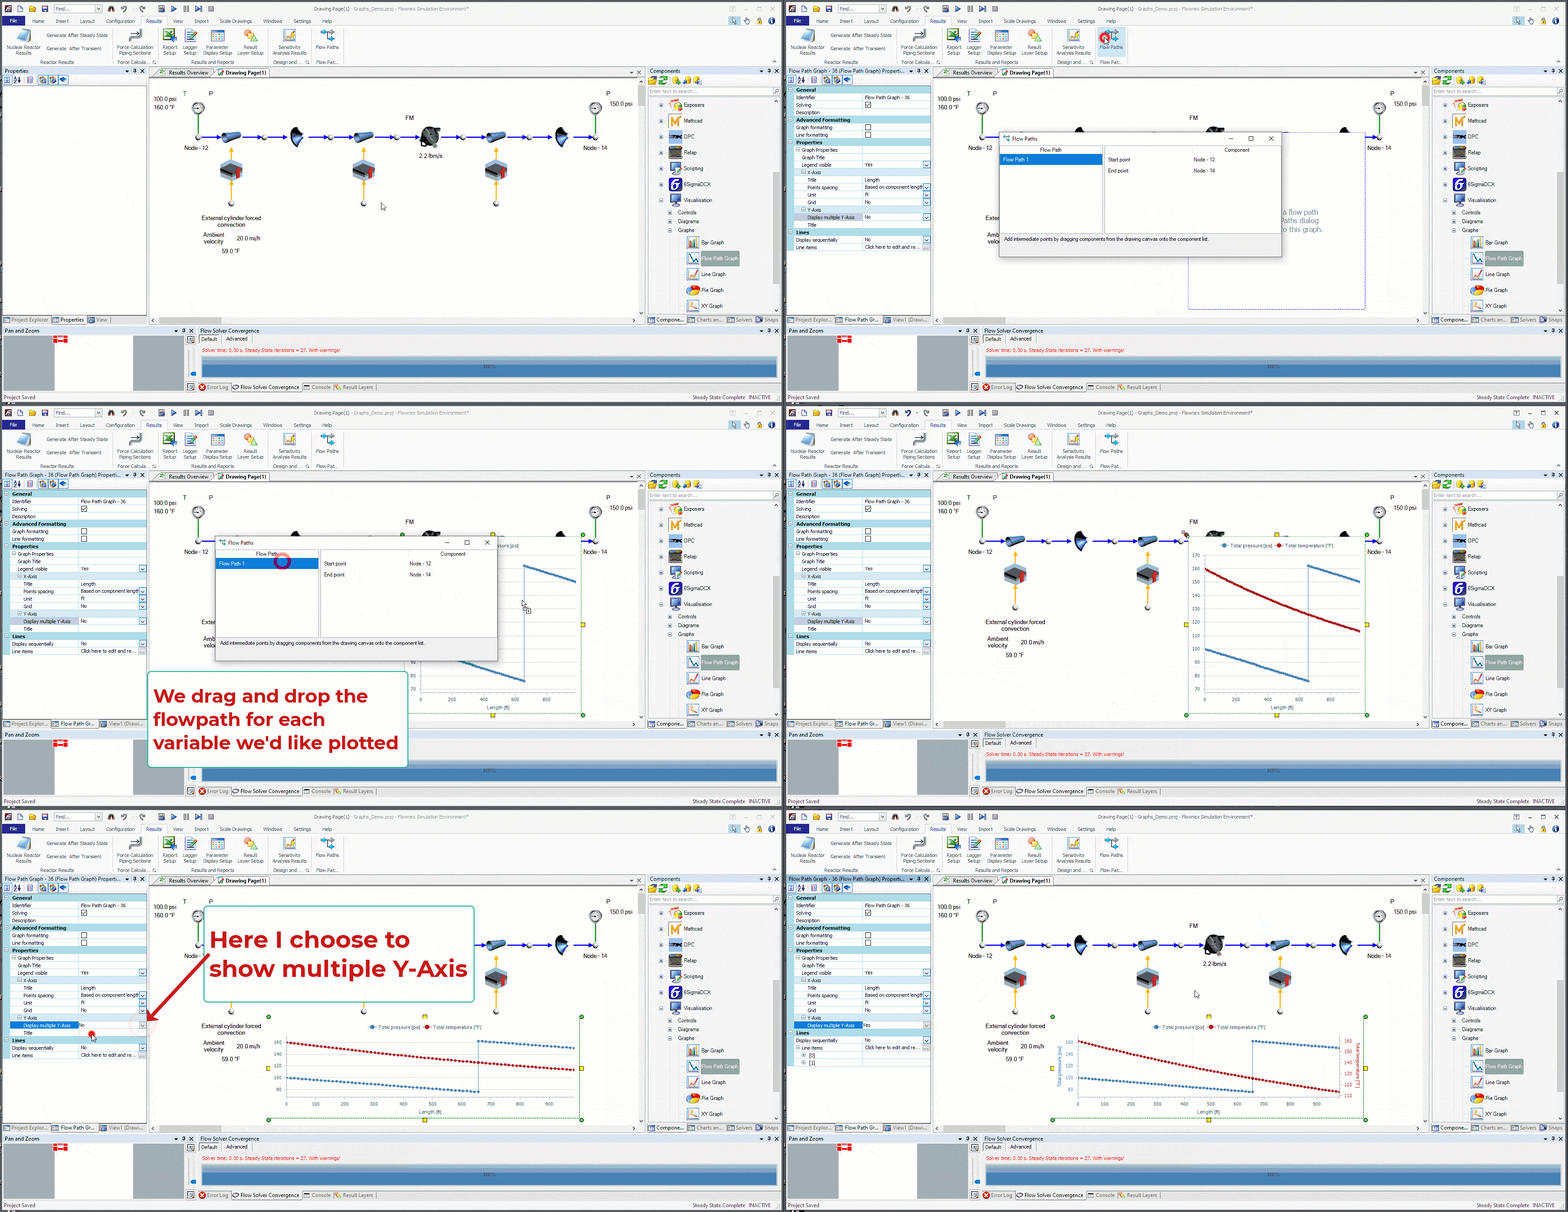
A flow path is any continuous series of flow elements and can be created by clicking “Flow Paths” in the results ribbon. Once we’ve created our new flow path we define it by choosing our start and end nodes.
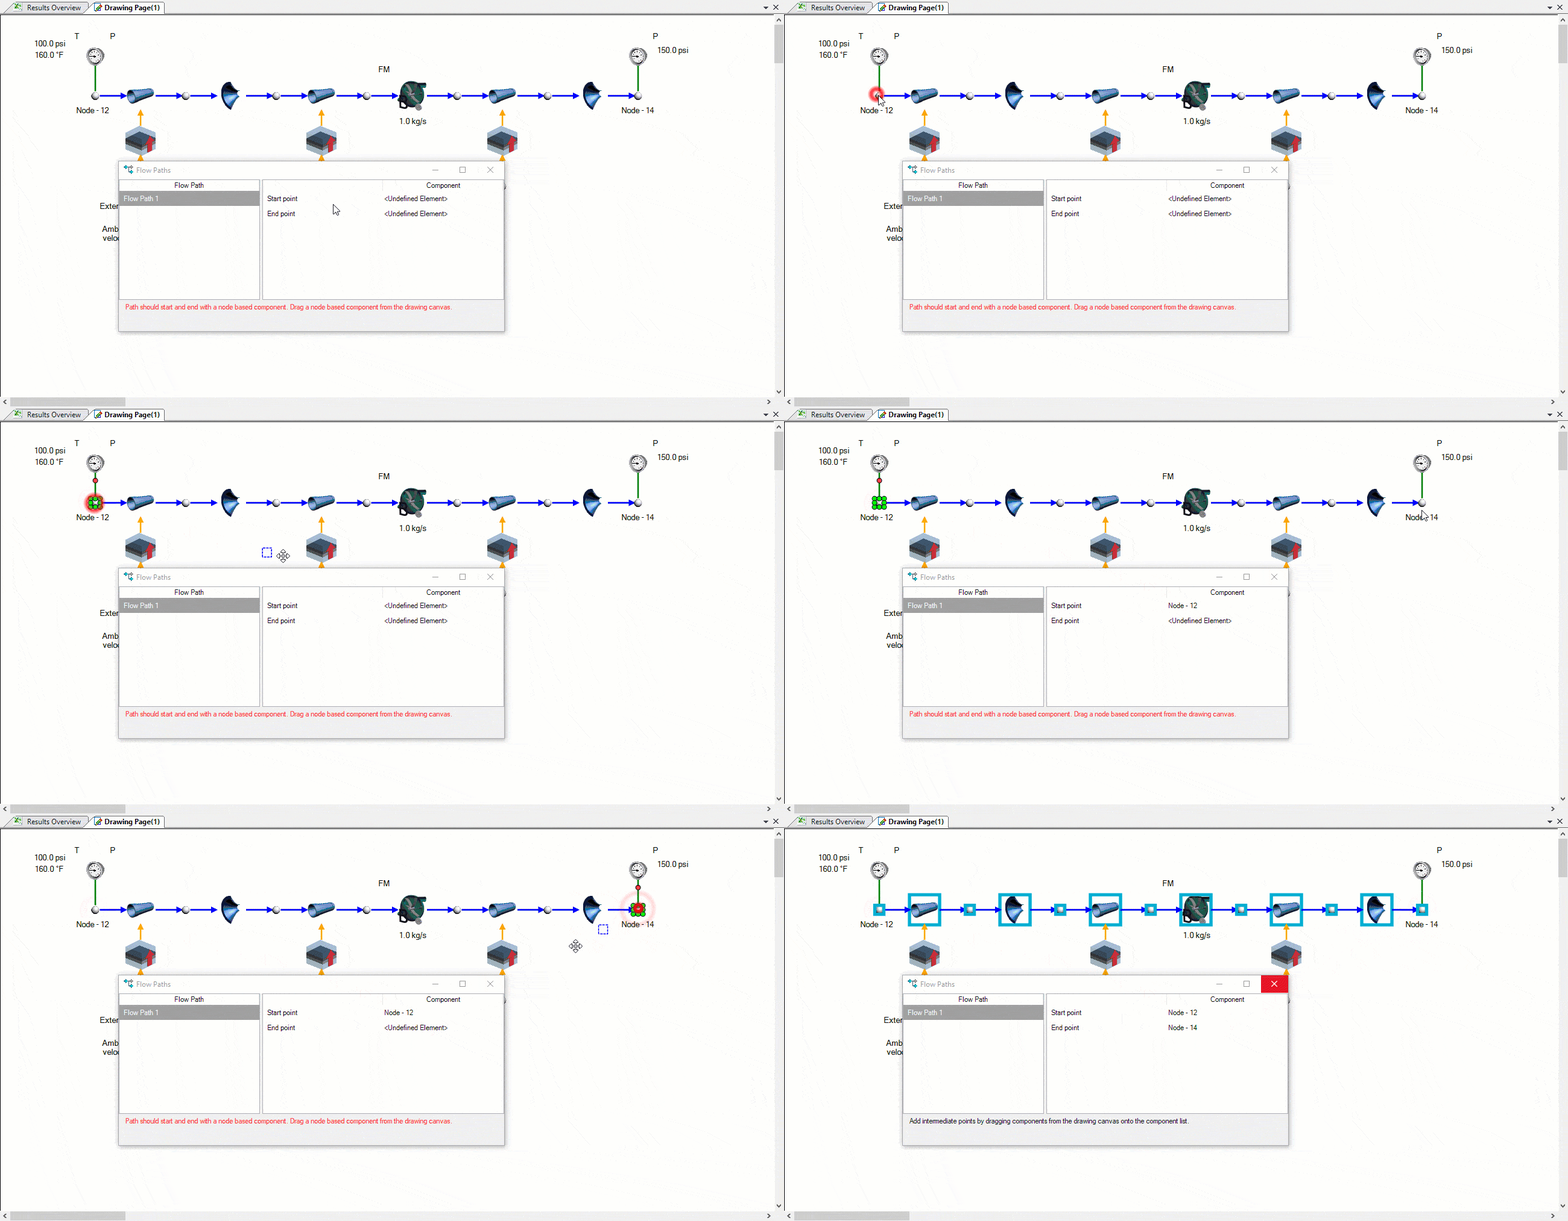
Another, simpler, method is to simply drag and drop the nodes onto the flow path start and end point:
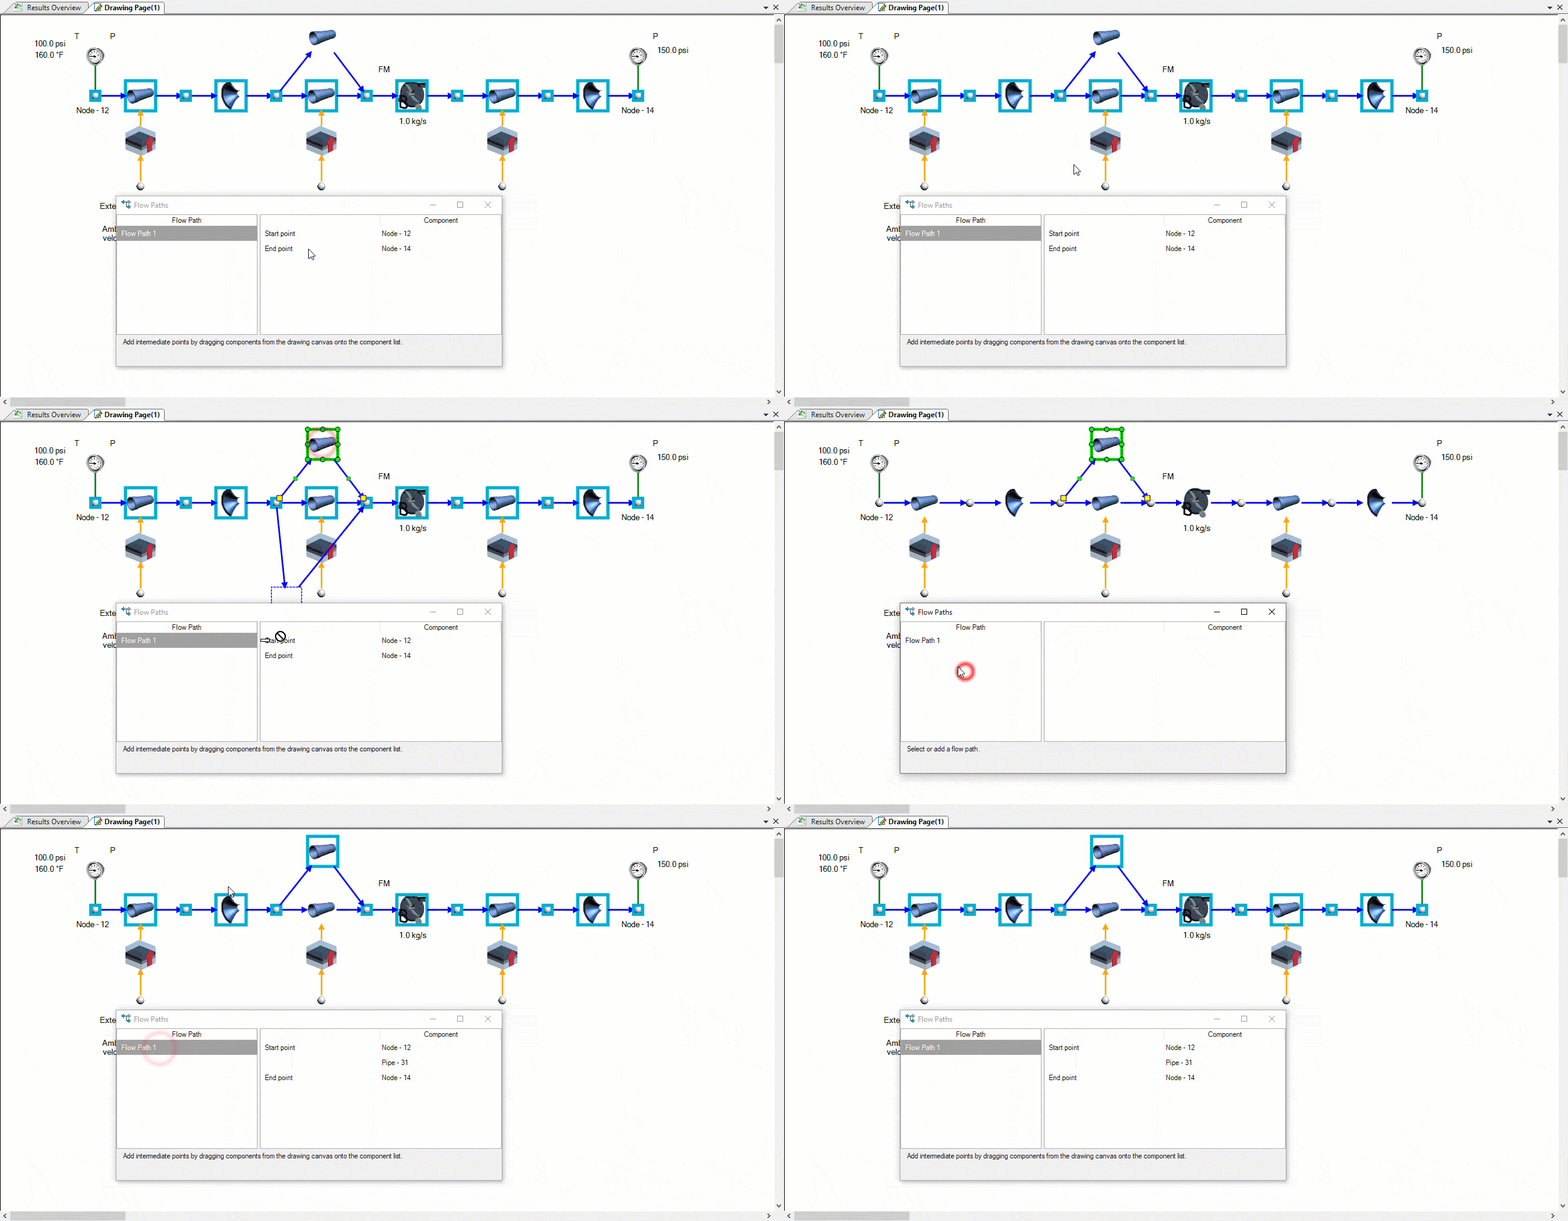
If we have a branched network we can add an intermediate node or flow component to our flow path to ensure the correct path is captured in the graph:
Insert a Flow Path Graph
The Flow Path Graph is in the component pane under visualization > graphs. Once the graph is added to the canvas we simply need to drag and drop our newly created flow path onto the graph and choose the characteristic we are interested in plotting. We will need to drag and drop the flow path for each characteristic we would like plotted.
How to create Increment Plots
You may have noticed in the previous images that there were many data points on the graphs for each of our flow components. This is because we had each pipe modeled as 25 increments. When we add increments to our flow components Flownex will treat each component as if it were split up that number of increments – solving the conservation equations for each increment rather than once over the entire component. This is helpful when modeling long pipes, capturing pressure waves, or determining exactly where a phase change may happen. A good way to think about this is that it is essentially the same as refining a mesh in a typical finite element analysis.
There is another plot in Flownex we can use for a single flow component that has been incremented. The increment plot is located in the components pane under Visualization > Graphs > Increment Plots. If we were, for example, trying to plot the inside surface temperature of our first pipe in this example network we could use an increment plot to see what is going on.
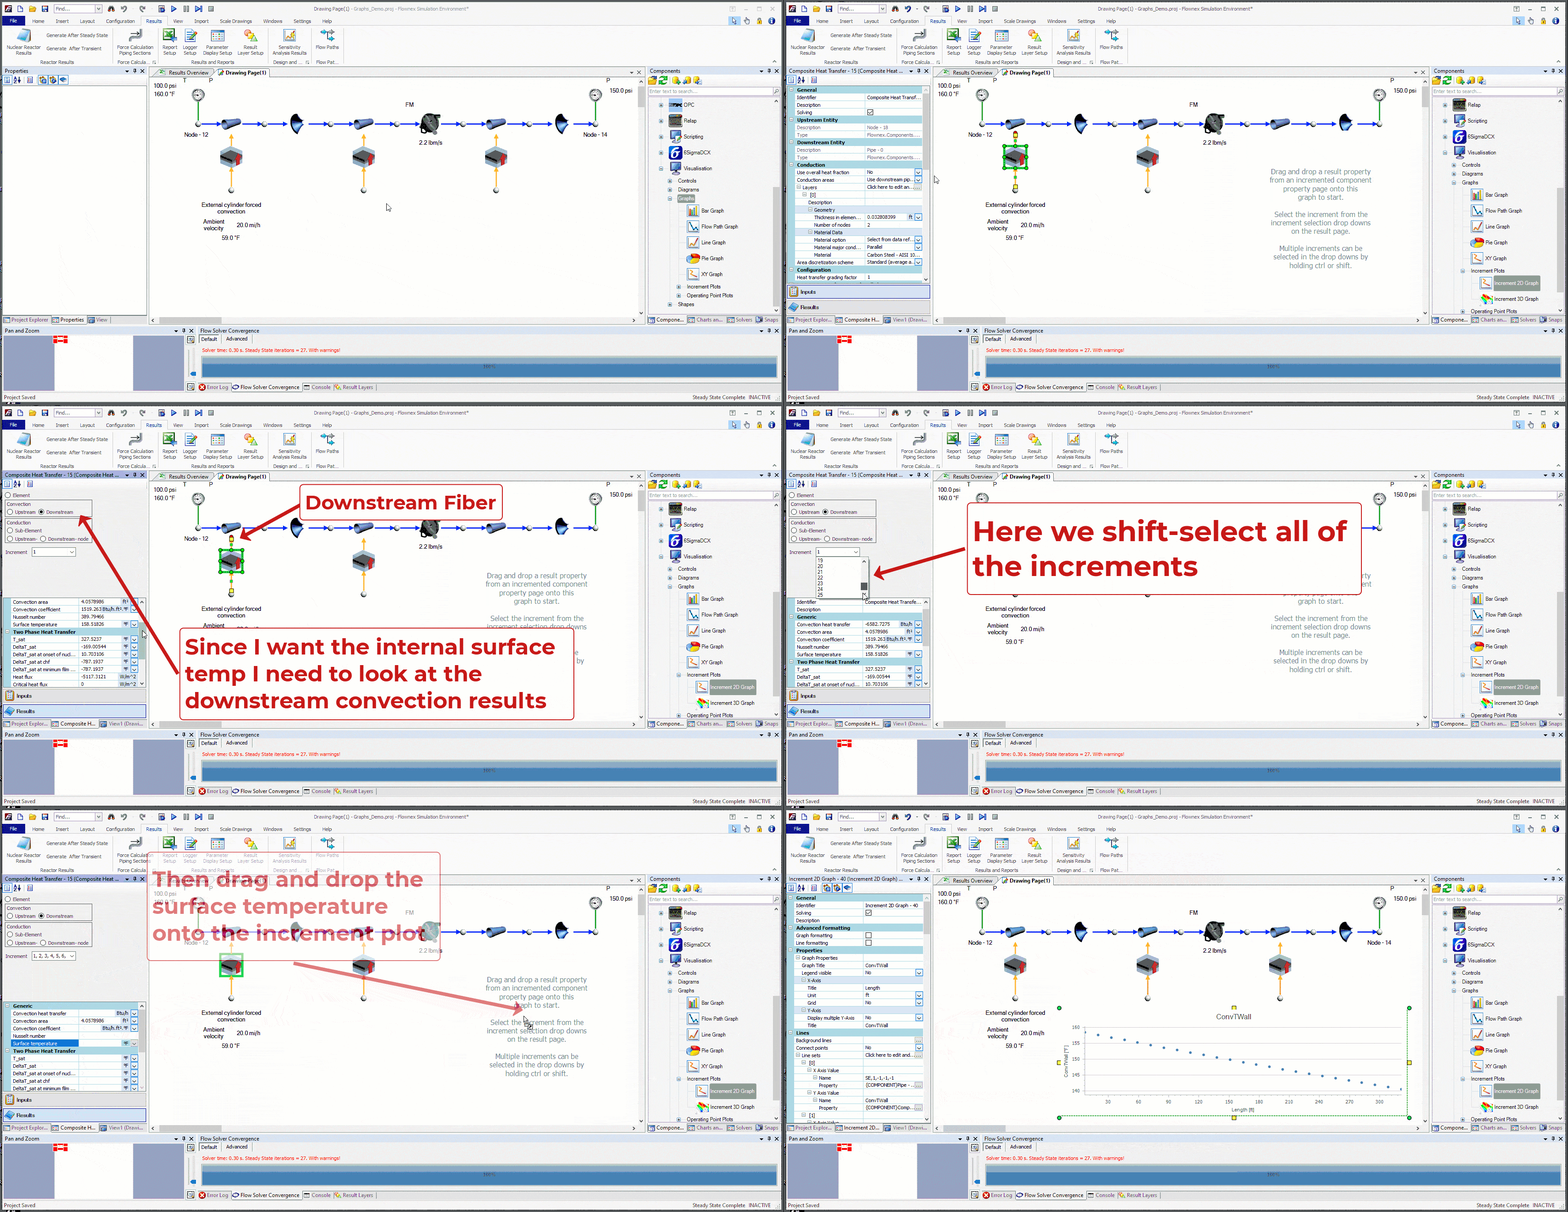
To create an increment plot we simply drag and drop the plot onto the canvas. We can either selectively drag results from individual increments or multi-select many increments and drag the desired variable onto the graph. Note that since there is a tie of each increment parameter separately there may be some delay if we are multiselecting a very large number of increments.
Bonus Tips!
- We can use a Flow Path graph for a single component to avoid having to multi-select increments.
- To create a graph on its own page instead of floating on the canvas go to the Project Explorer pane on the left side of the GUI, select Graphs, then right-click on the Graphs Folder and select Add Graph Page and choose your desired type of plot.

