Friday Flownex Tech Tips #5
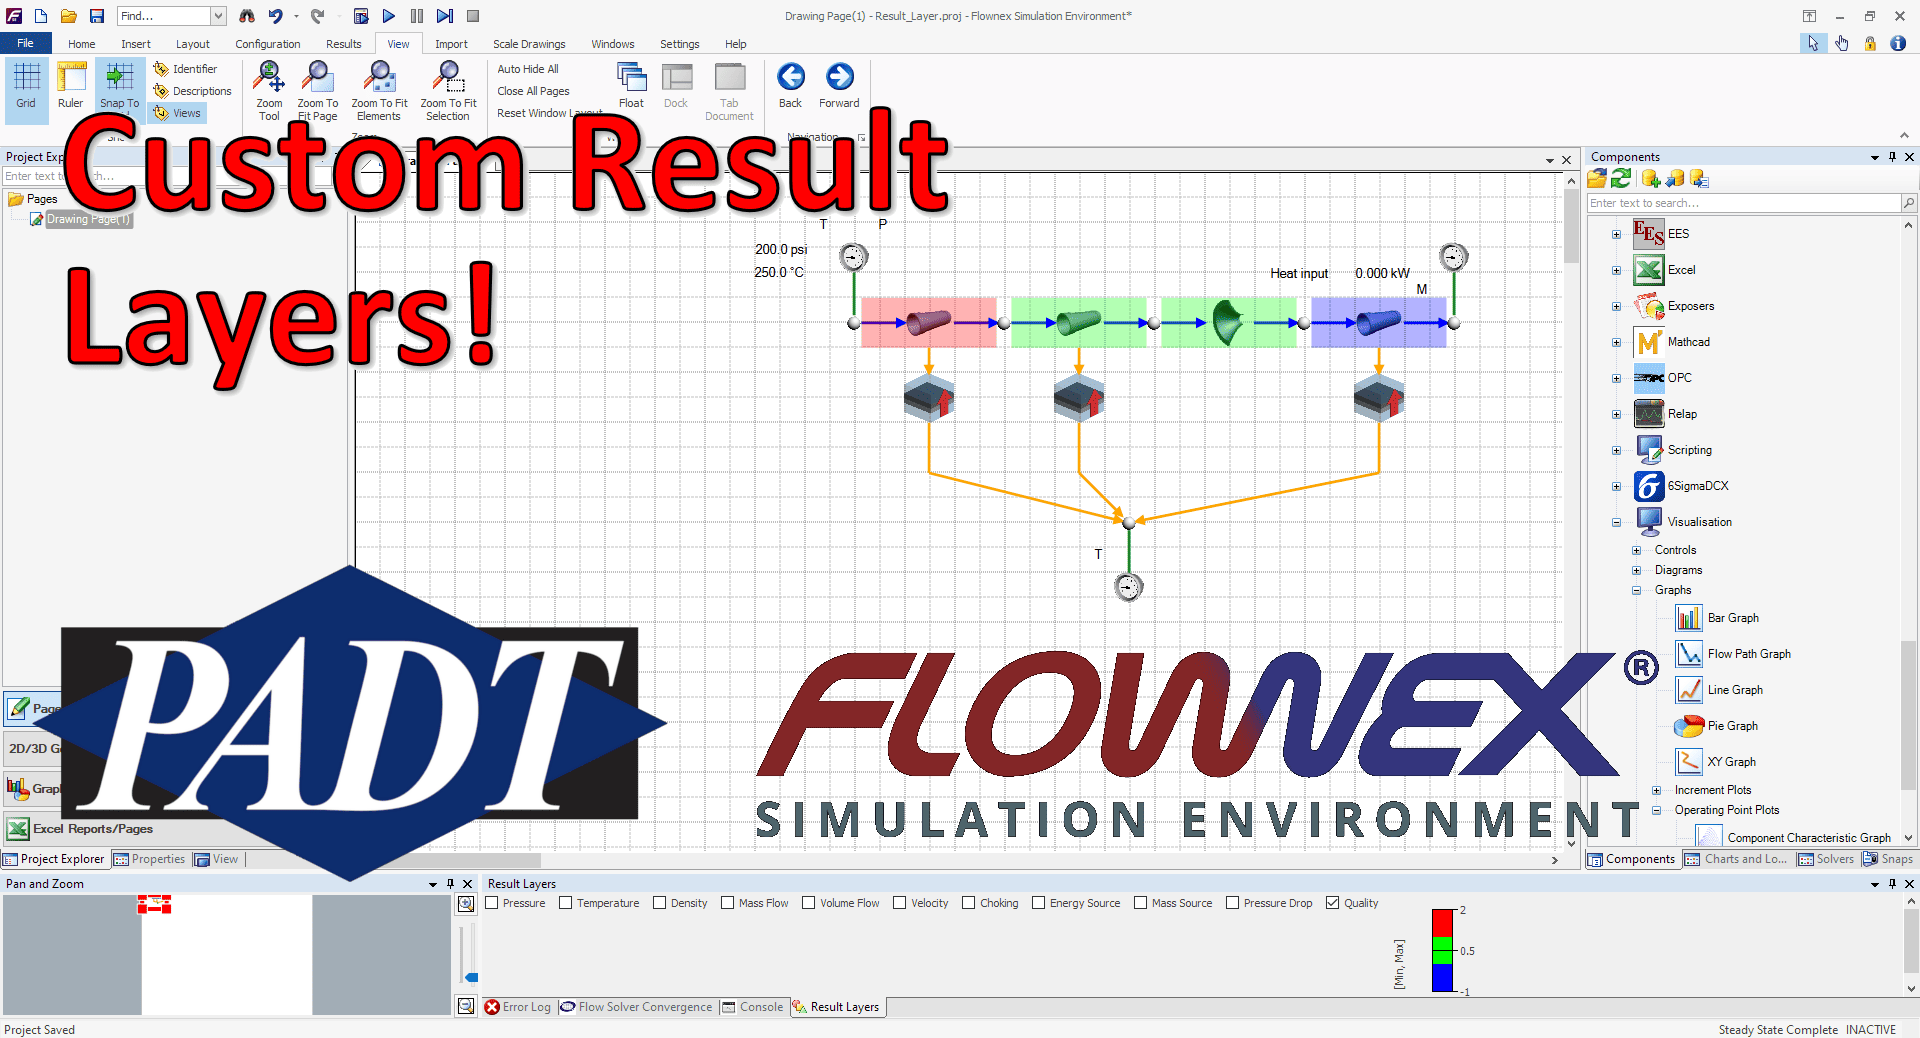
The result layers in Flownex have evolved quite a bit over the last few iterations of the code. Although we might typically associate color-gradient results more with 3D CFD, it does have a place in 1D system modeling. Taking advantage of results layers in Flownex can give a very quick understanding of what is going on with our system, and, with a little customization, can be incredibly powerful as an addition to our design and analysis toolbelt. In this post I am using Flownex version 8.12.7.4334.
How to create a result layer
To create a custom result layer we must navigate to the results ribbon and select result layer setup.

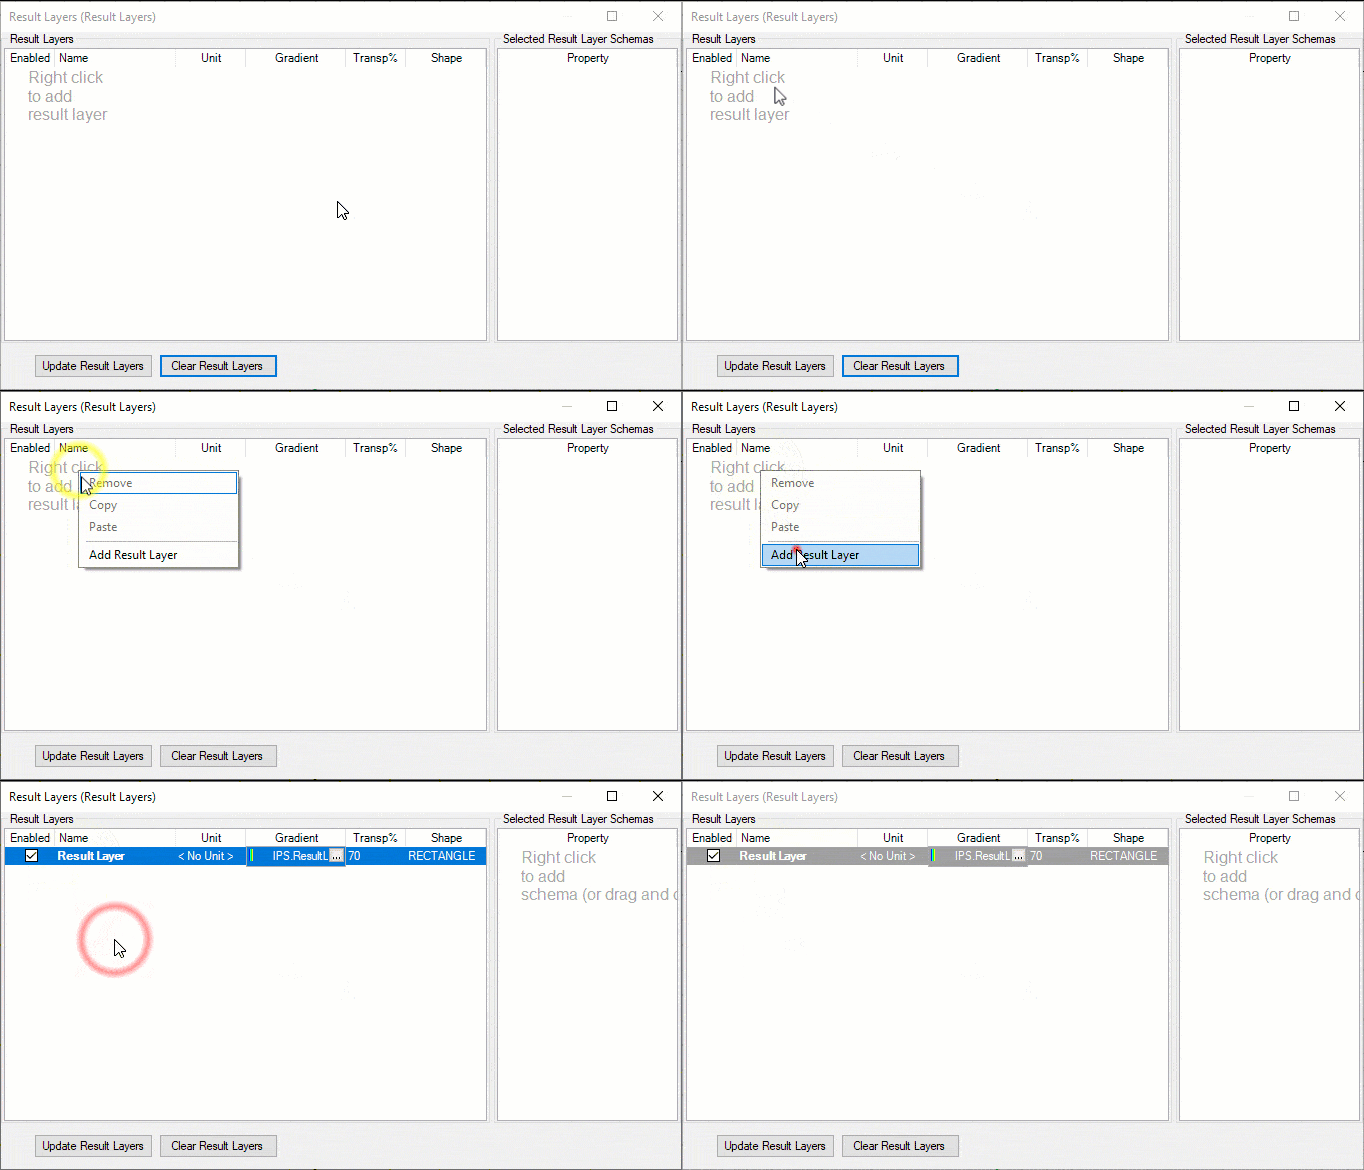
First we want to right-click in the Result Layers window and add a new result layer.
There are two options to add the schema for our result layer. The first is to right-click on the Selected Result Layer Schemas and add either a specific or generic schema. The second, and my PREFERRED, method is to simply drag and drop results from components on the canvas into this window:
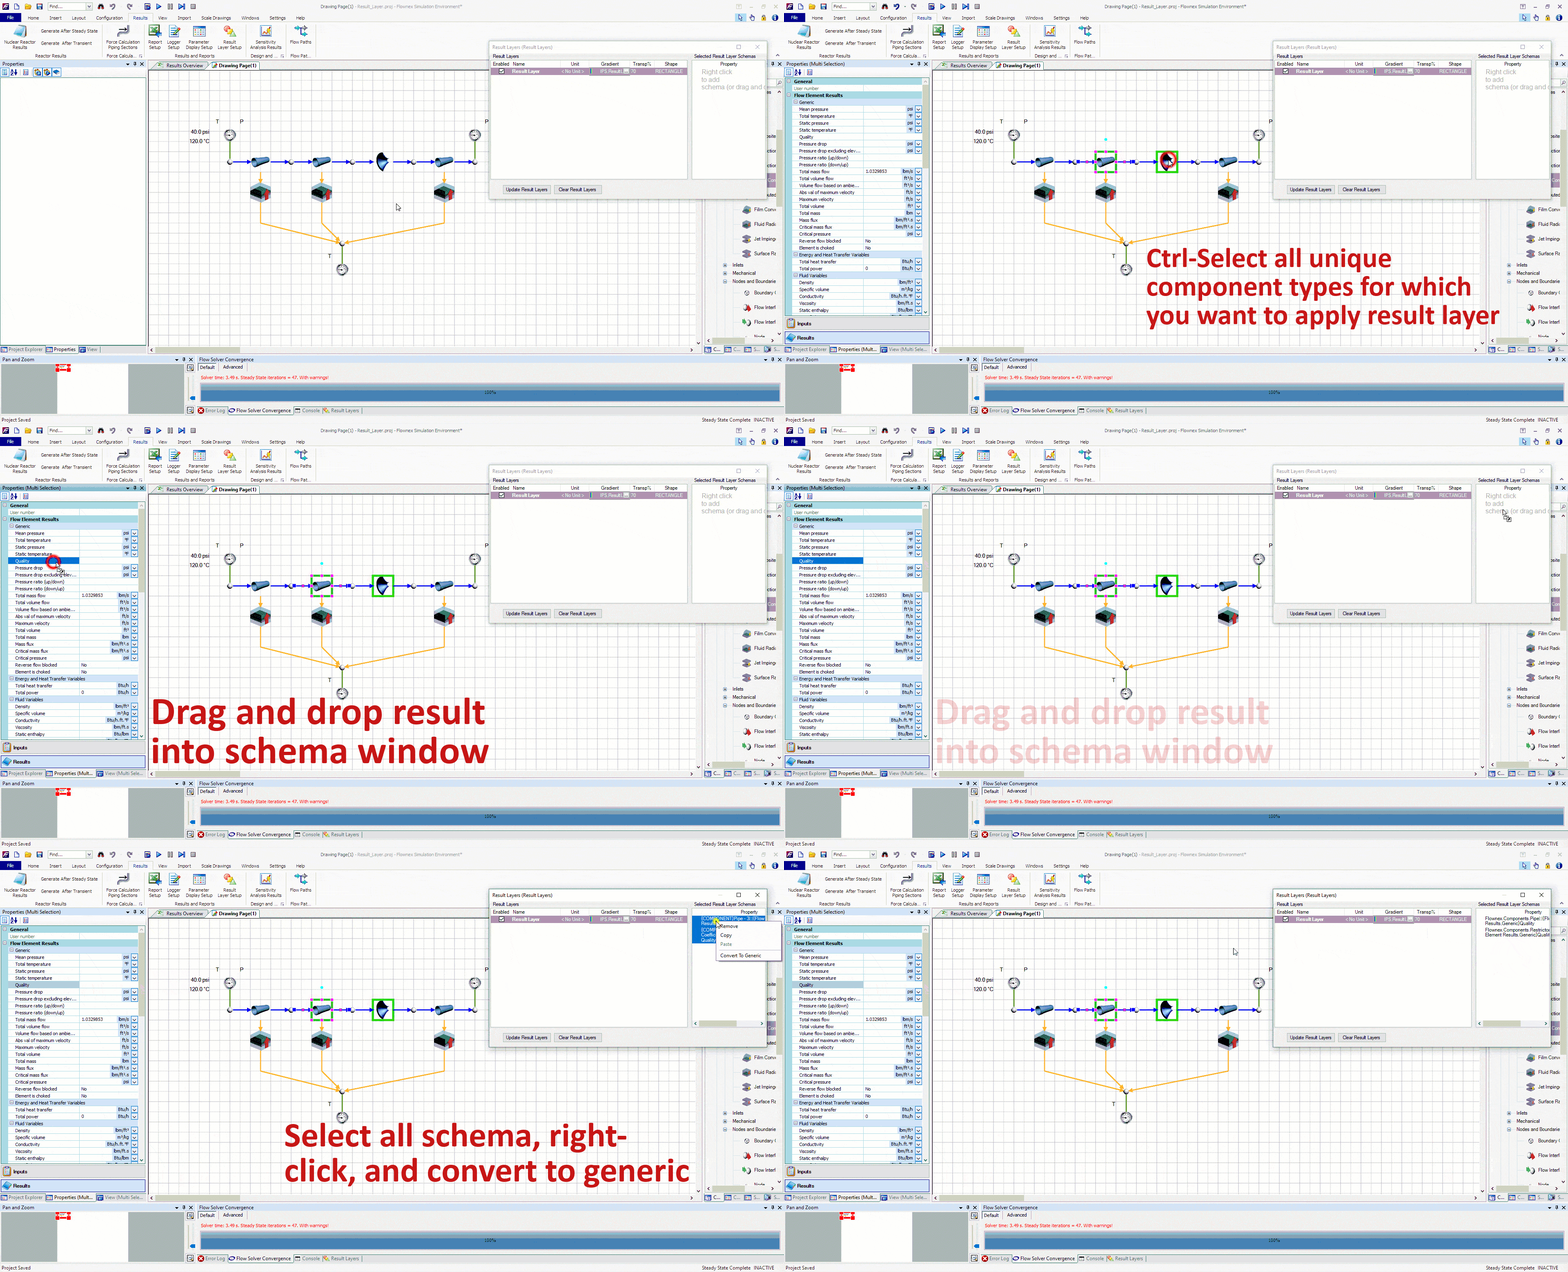
Note that I want to multi-select any component types which will be included in this result layer. This could be any flow components which share a common result such as “quality”. I also convert to generic because I want the result layer to apply to all pipes, not just the pipe I initially drag and drop the property from.
Defining the custom result layer
In this example I have a two-phase water network with a cold external temperature. I want to create a result layer to quickly see if the water is in the gas phase, liquid phase, or somewhere in-between. The problem I have been tasked with solving is ensuring that the water never condenses. I will need to determine where we may need to add additional heat flux to the network.
We can use the Quality result property to determine the phase of our fluid. Quality < 0 indicates fully liquid, quality between 0 and 1 indicates liquid/gas mixture, greater than 1 indicates fully vapor.
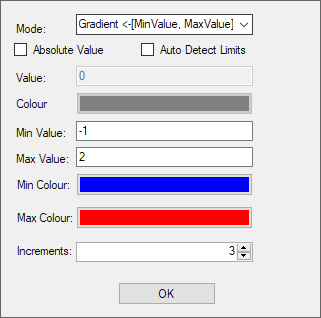
To make this work as intended I can set up a gradient with three increments going from -1 to 2. The idea being the lowest increment would encompass -1 to 0, middle increment would be 0 to 1, and the top increment would be 1 to 2. For the gradient mode I made sure to pick <-[MinValue, MaxValue]-> so that the max and min increments would extend past the specified range.
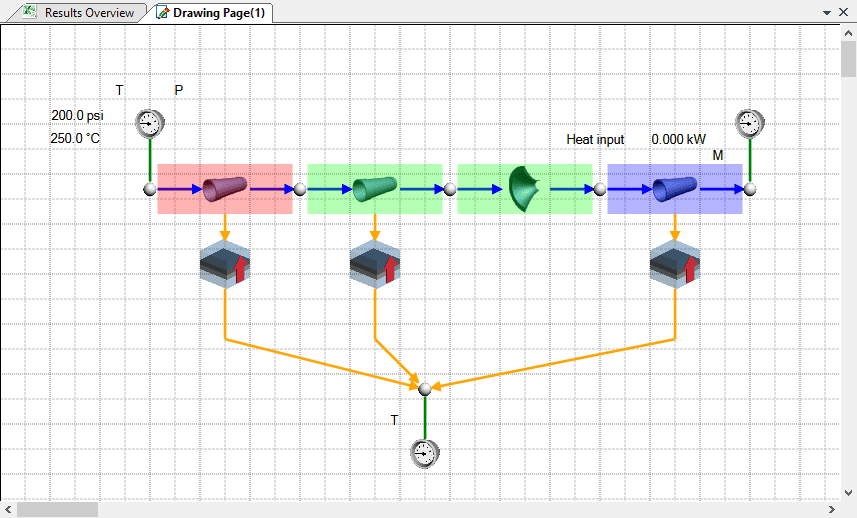
As we apply this to our network we can easily see that we do, in fact, have a phase change from gas at the inlet, to mixture in the second two component, to fully liquid near the outlet.
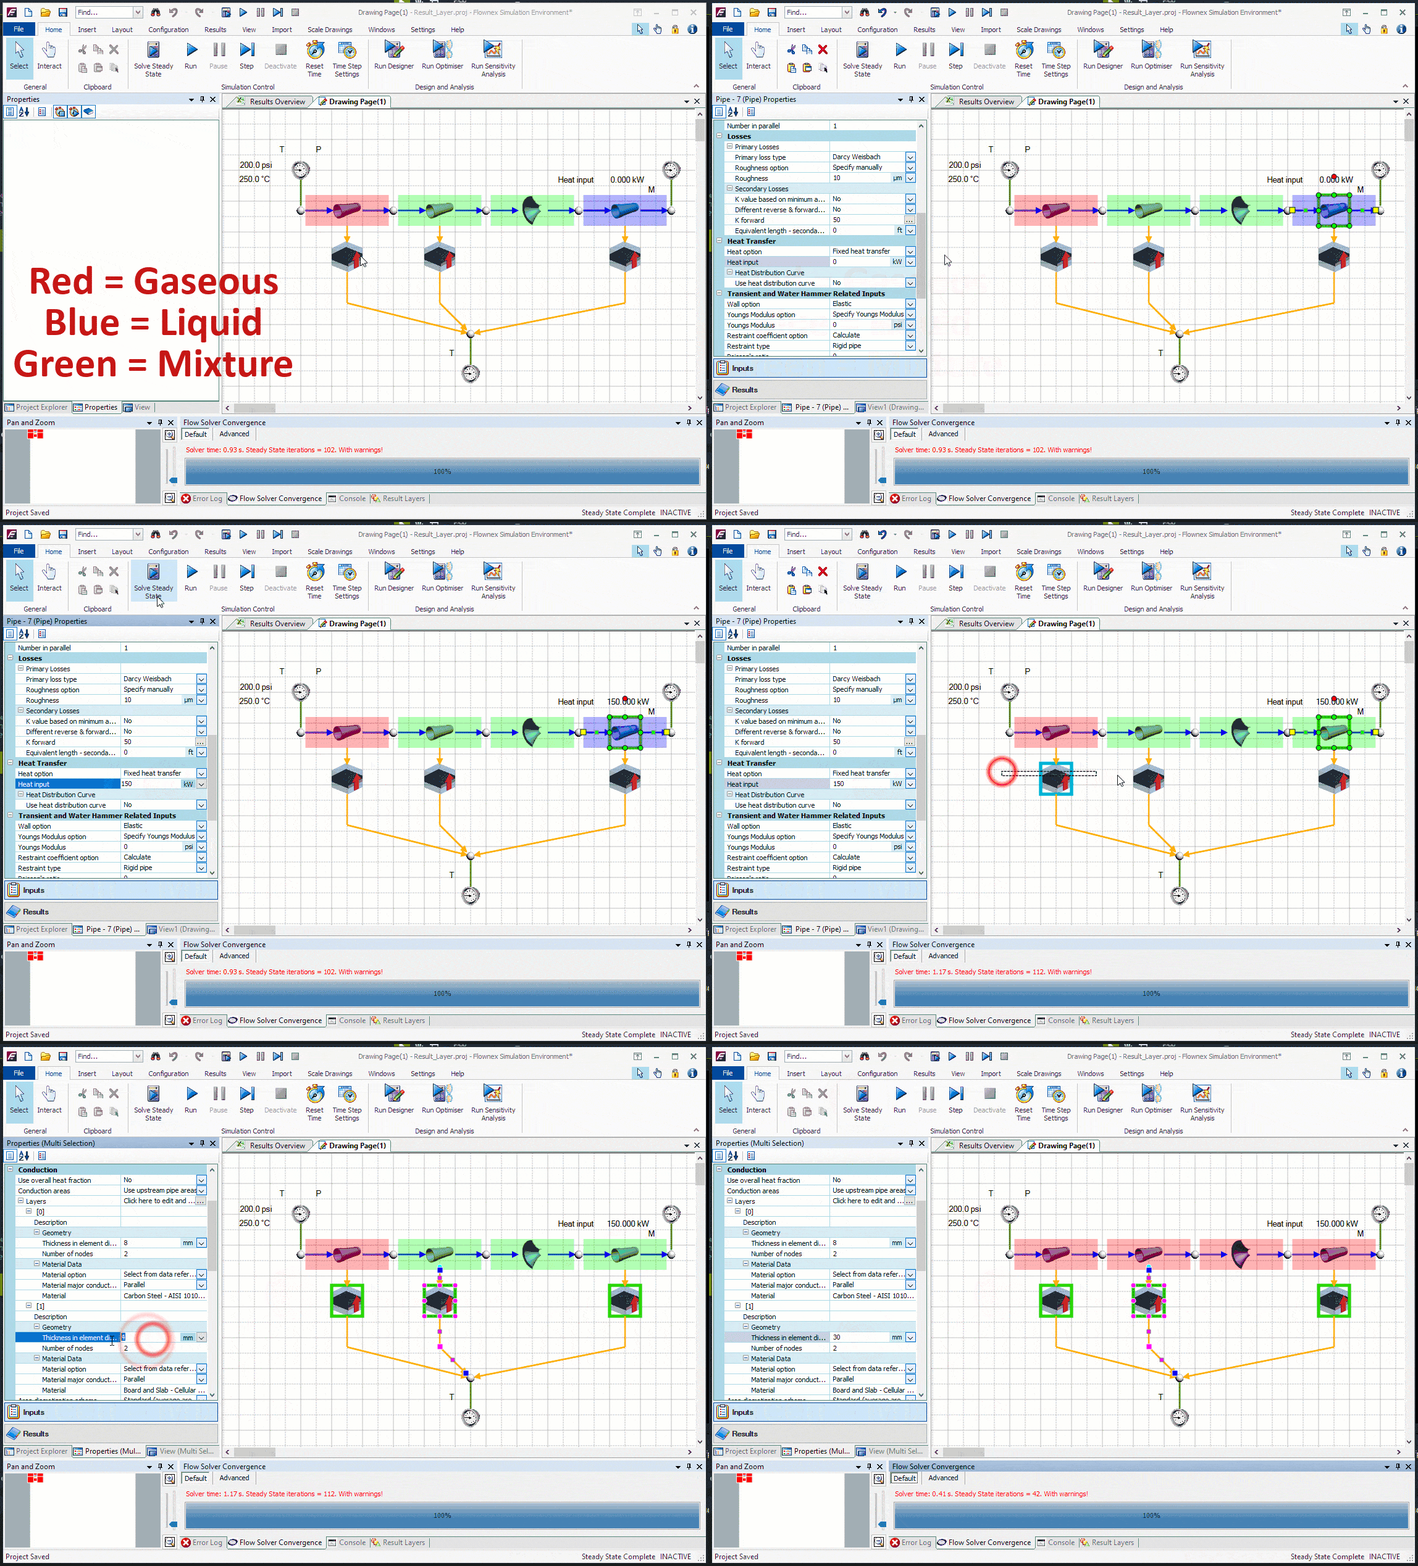
I may decide to add a heater to our outlet pipe and perhaps a thicker insulative layer to all three to attempt to keep the water in gas phase throughout the system.
Bonus Tip!
- Result layers can also be super handy when troubleshooting to quickly identify large pressure differentials, choking points, or other outlying fluid properties.

