Friday Flownex Tech Tips #14
Today’s tech tip will be short and sweet. We’re going to go over how to do a real-time plot in Flownex. In this example we’re using Flownex version 8.12.7.4334
Adding a Time Dependent Graph
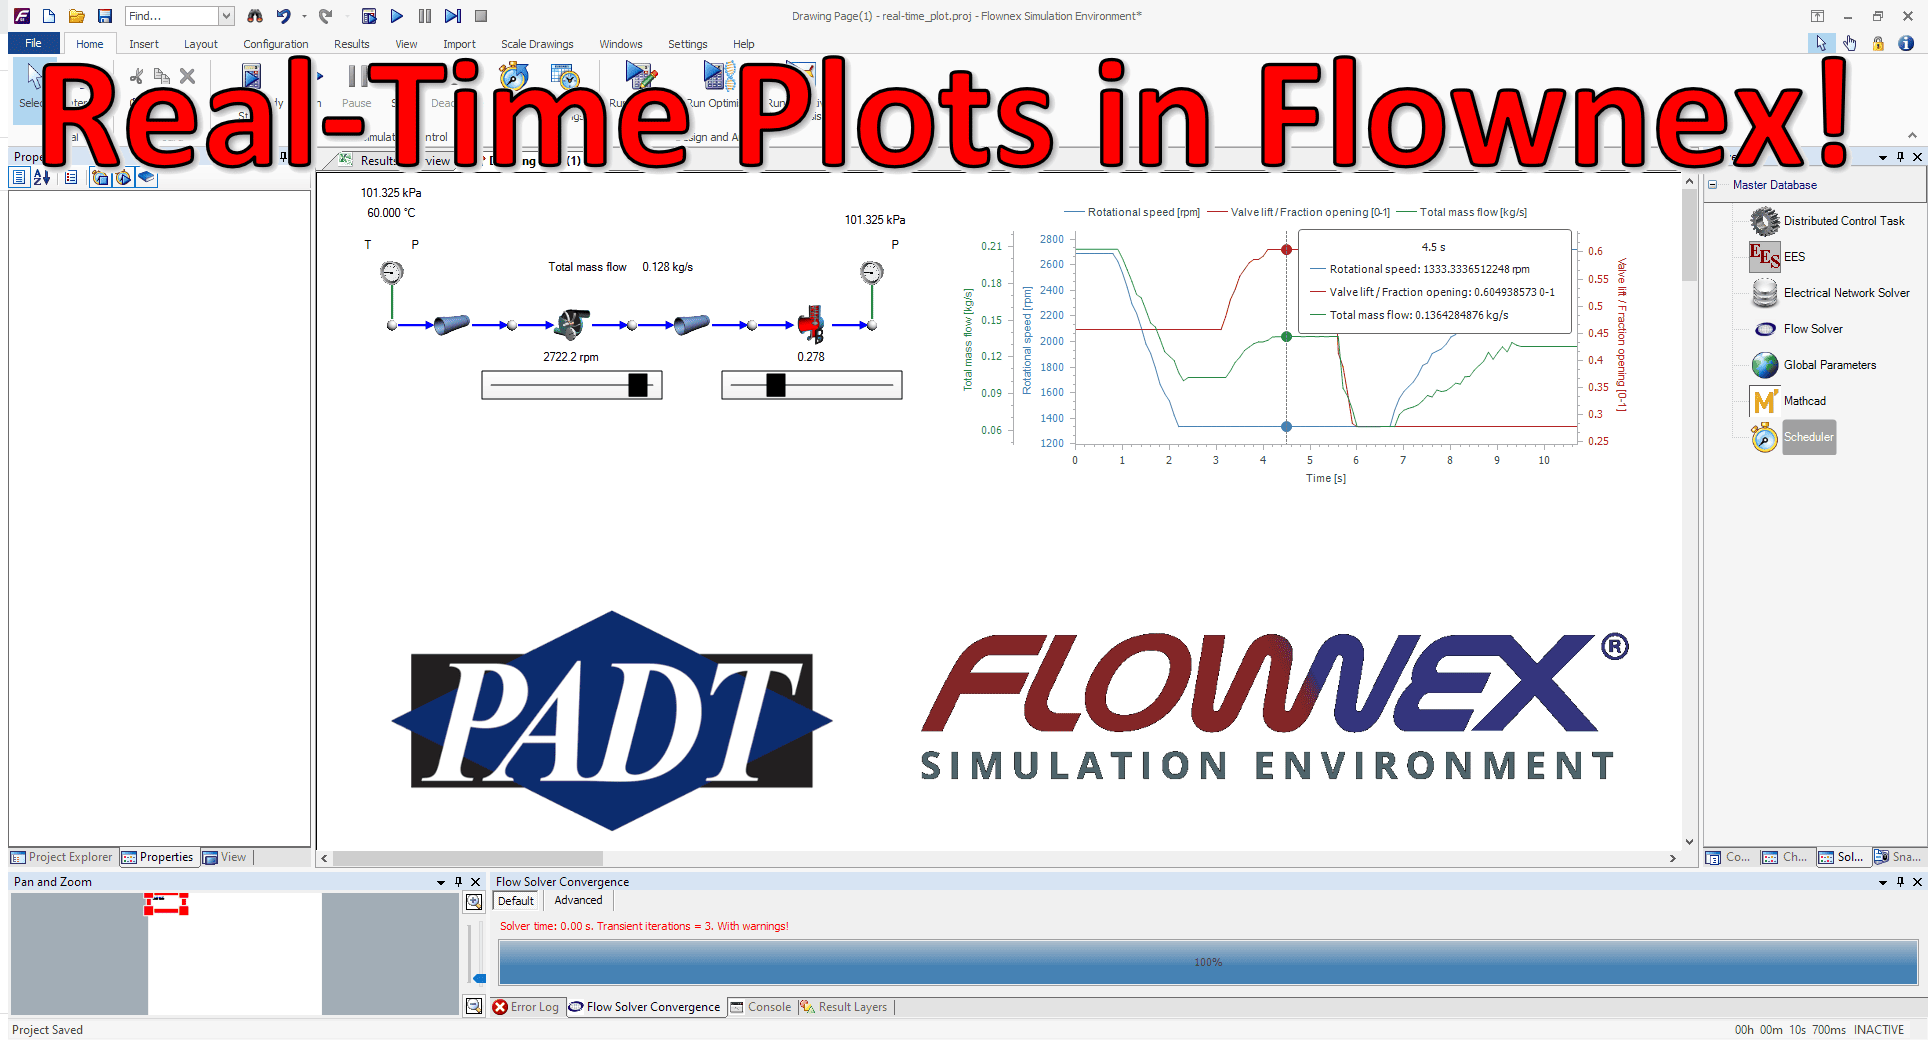
For a time dependent graph we will choose the Line Graph under the Visualization library on the Components pane. We can drag and drop the variables we’d like to see plotted here. I’m going to look at the pump speed (rpm), the valve fraction open, and the mass flow through our network.

On the graph properties we’ll likely want multiple Y-axis enabled so that the changes are easily seen as a function of time.

Real-Time Transient
To have our transient analysis solve in real-time we will need to go to the Solver Ribbon and click on Scheduler to access our transient settings. Here we can change the Running Speed to “Realtime”.

Now when we run our analysis we will get real-time response! This comes in super handy when building human machine interfaces in Flownex for testing operations, when we want to observe response of controls systems, or observing start-up/shut-down type scenarios.