Today, I will be discussing how to use a quick script component to calculate wave speed for a pipe in Flownex. We will be developing a script to determine the wave speed in two elastic tubes in different scenarios. Both networks are dependent on the 1D tube geometry and mechanical properties. Longitudinal pressure waves may be modeled in Flownex within a wide variety of materials or timescales.
First, we will calculate the pulse wave velocity (PWV). This is a non-invasive method of determining arterial stiffness using the blood pressure measured at to different arteries, used as an indicator of cardiovascular health. Next, we will apply the script to a pipe with a sudden valve closure to calculate the wave speed and the reflection time of the pressure wave. For this example, we will be using Flownex version 8.14.1.4845.
Choosing Components and Boundary Conditions
We will be simulating the wave speed of due to an influx of 60cc of blood (I will be creating a custom fluid for this) over a 0.1s interval (throughout our simulation) to produce a pressure wave. This arbitrary pressure wave will allow us to visualize the wave speed of the artery. We can simulate the artery by dragging and dropping a pipe component onto the canvas and placing boundary conditions on the inlet and outlet.
Next, we will specify a zero-mass flow at the inlet, and set the temperature to 35°C.

We will use a constant pressure for our outlet boundary condition.
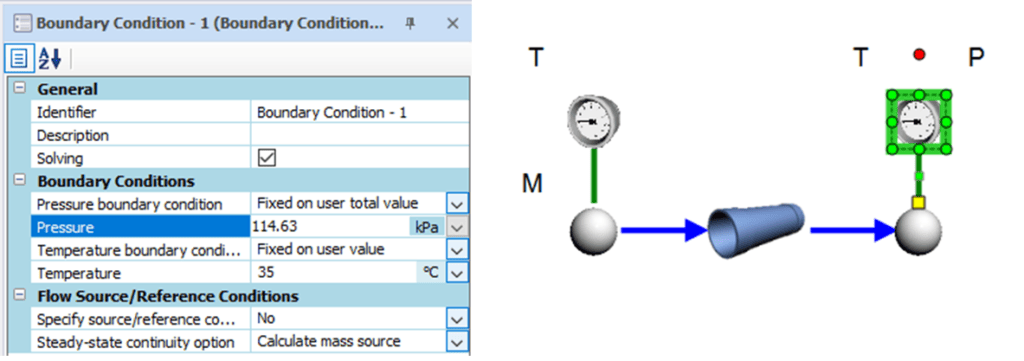
Lastly, we will assign our inlet node to contain a volume of 60cm3.


Next, we can define the vessel geometry. We will check “Specify advanced inputs” in the pipe properties, allowing us to access the “Transient and Water Hammer Related Inputs” subset of mechanical properties. We will model a simplified aorta with a diameter of 25mm and a length of 30.48cm. Additional mechanical properties of the pipe are shown below:
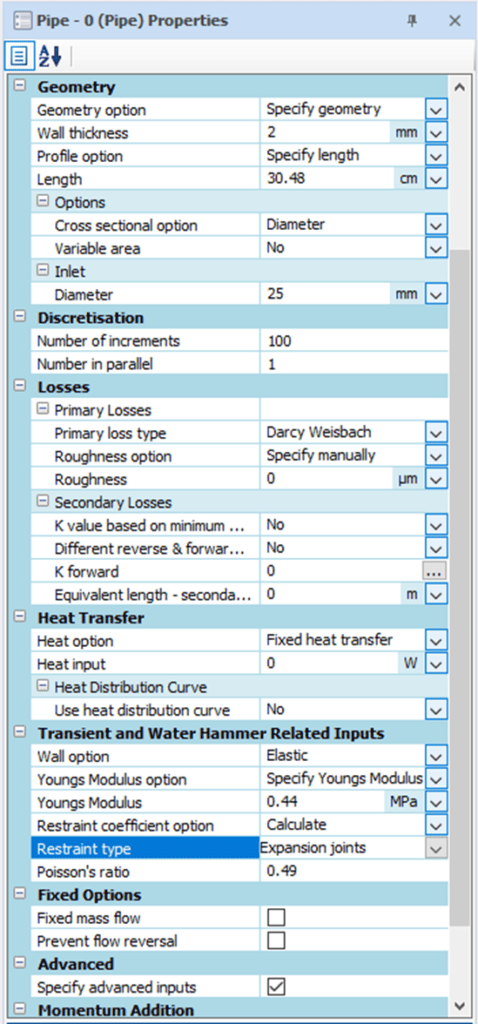
Flownex will use the diameter to thickness ratio to determine if a thin wall model is necessary for the simulation. A diameter to thickness ratio above 40:1 will use a thin-walled pipe model.
Transient Actions Setup
Now that we have defined our boundary conditions, we can setup an action to perform this task by navigating to the configuration tab in the ribbon and clicking on Action Setup. Additional information on setting up transient actions form a table can be found here.
We will create a New Scenario in the actions setup and set the target property to the volume of the inlet node. We can do this by selecting the node and by dragging the volume from the inlet node properties (left) window into the actions setup (right).

Setting the value type to table will allow us to create a constant volume flow rate at the inlet after the no flow initial condition, using the input below.
Calculating Wave Speed
We can also easily calculate the wave speed of a component, using a quick script. Quick scripts are easily implemented, and we will specify unit types to allow Flownex to evaluate unit conversions for calculating wave speeds. I won’t cover quick script/data transfer link setup in this post, but you can find a previous example here. After inserting a quick script component, we can double click on it to modify the inputs, outputs, and calculation.
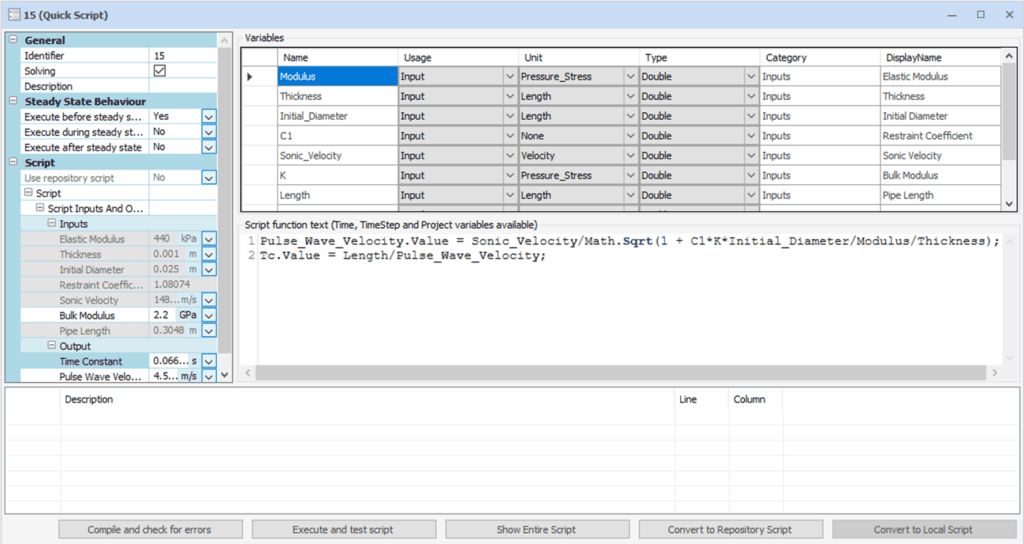
Rather than recomputing the speed of sound of our fluid, we will take it directly from the properties of the pipe. Additionally, we can calculate the time when the wave will reach our boundary. The PWV along multiple pipe components (such as carotid-femoral PWV or examining a pipe main in a complex network) can be also calculated with direct referencing to avoid using data transfer links to pipe components in a quick script.
Simulation Setup
We have defined the time constant (the time which the wave will reach the end of the pipe). We will use this to determine the duration of our simulation. We can specify our end time as our time constant (0.055435s).

Next, if we right click on the inlet node, we can hover over “Plot a Flow Path” and select Total Pressure. This can be plotted for any pathway specified through a network by explicitly specifying a flow path, covered in a previous post. Plotting the flow path will allow us to visualize the pressure profile across the length of the artery. We can solve steady state for our initial conditions and run the solution our network and run our solution.
Simulation Results
We can see a plot of the longitudinal pressure wave in the vessel below
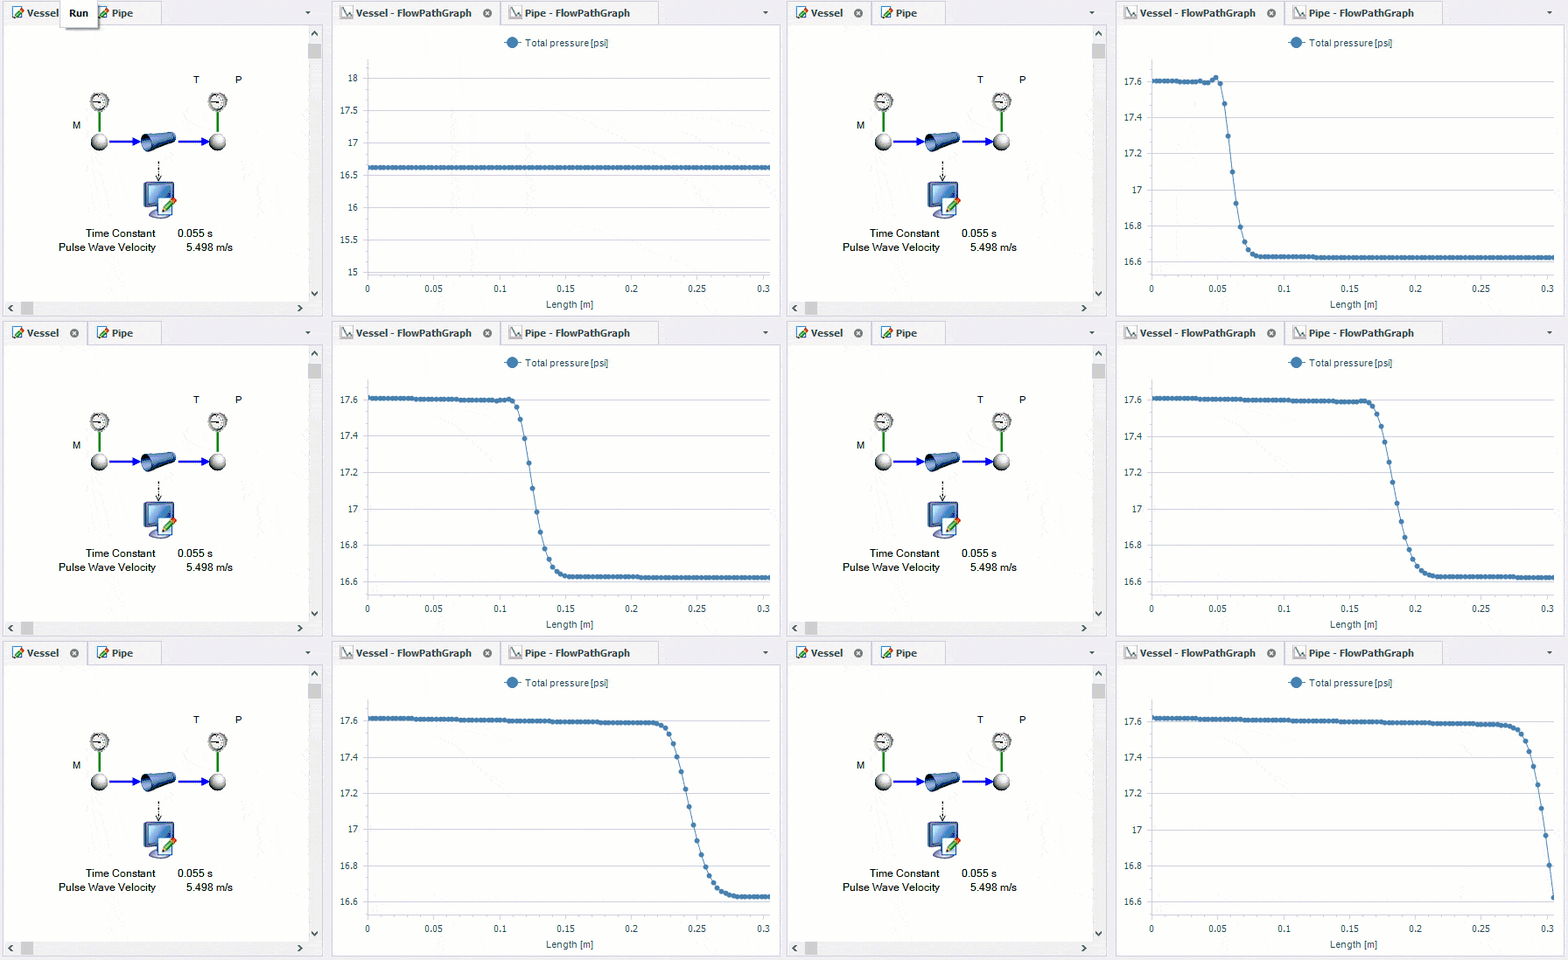
The pressure wave propagation will depend on the impedance mismatch of the downstream vasculature due to changes in diameter or arterial bifurcations.
Lastly, we can us the same procedure to model the wave reflection in the piping system used for Demo Network 4. This network simulated a sudden valve closure on the righthand side of a steel pipe. Using our script, we can determine that the wave will take 0.07525 seconds to reach the other side of the 101m pipe.

We can visualize the wave reflection in our steel pipe back to the valve by doubling our time constant and running a transient simulation.
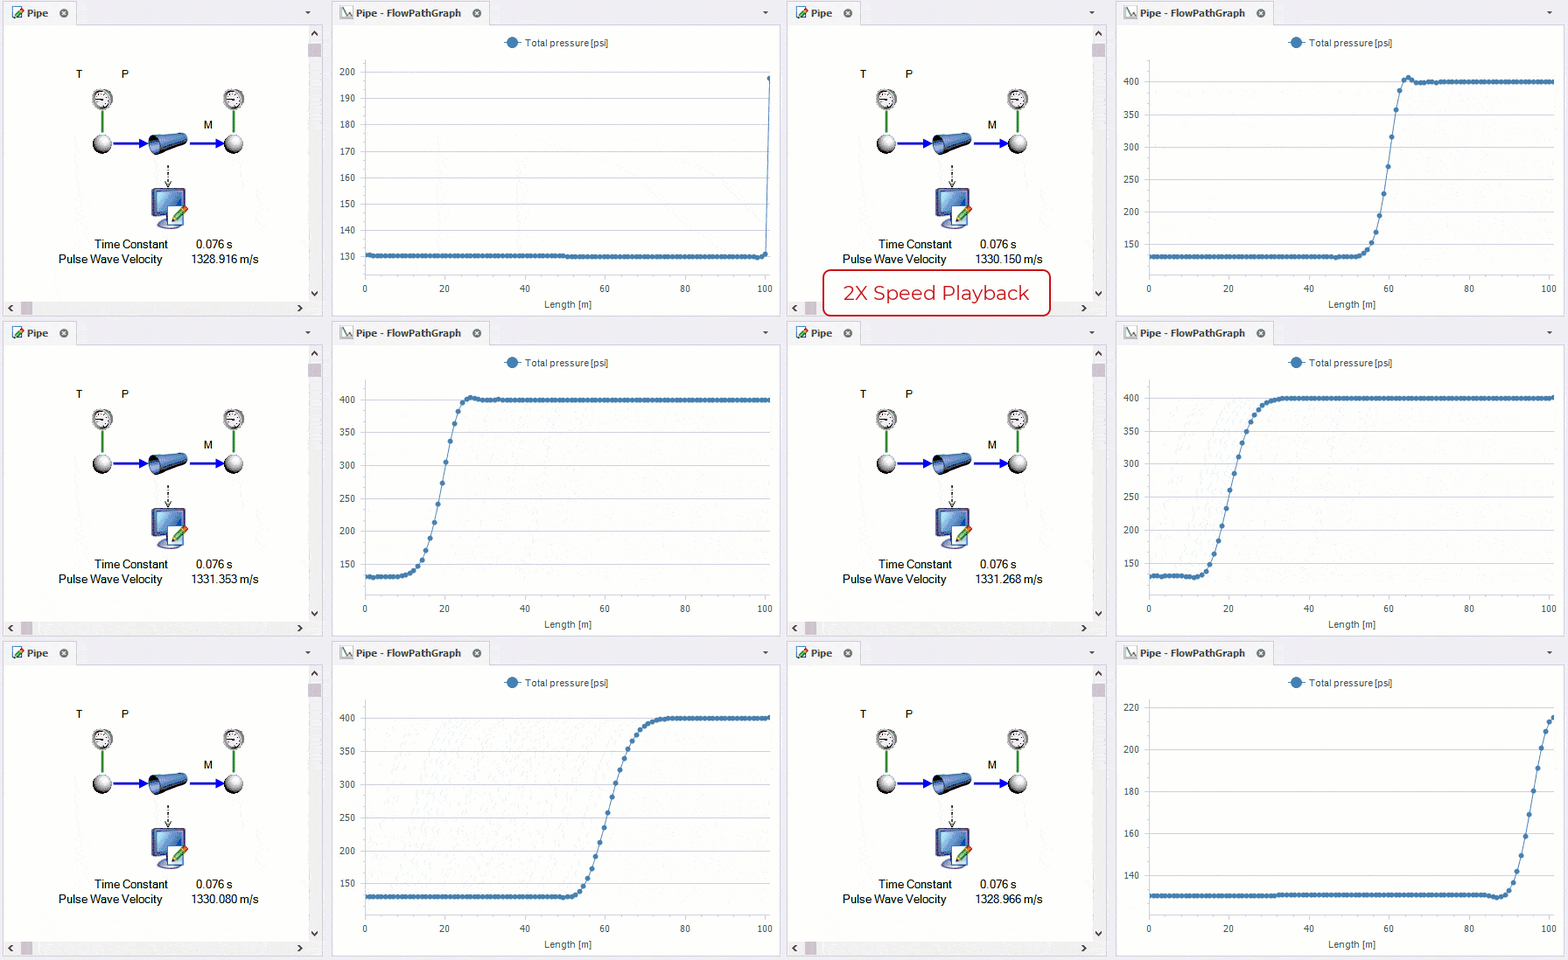
A flow path graph may also be used to visualize the placement of an accumulator along the pipe to dampen wave reflection to the valve.
We have seen that Flownex can easily model a wide variety of systems from pulse wave velocity to water hammer effects in piping systems. The pressure wave in the steel pipe(1329m/s) close to the speed of sound in open water, whereas the artery has a pulse wave velocity of 5.4983m/s, far below the speed of sound. Now, we can easily write a quick scripts to determine the speed which pressure waves will pass through a network pathway.


